ecu.test 2026.2 Release Notes
Release date: 09.06.2026
Overview
With ecu.test release 2026.2, we've expanded our AI capabilities, enhanced numerous ecu.test extras, and streamlined daily workflows in countless ways.
ecu.test agent
- End-to-end workflow from specification to test case to trace analysis
- Agentic multimedia test steps
- Intelligent copilot for ecu.test (preview)
ecu.test extras
- calibration: automatically verifies XCP connections.
- code: supports native Python data types and constants.
- diagnostics: delivers a wide range of new API methods in the DiagBrowser.
- drive: runs on Linux, too.
- lab: impresses with new widget capabilities.
ecu.test configuration
- Offline mode: keeps HiL and other test resources available and enables parallel development.
- Selective tool restart: restarts only the affected tools when test bench configuration settings change.
Everyday performance
- Linux GUI with graphical license manager and tool server.
- Library workspaces now support templates and report generators – and display the active Git branch.
- Model filters & aliases trim model trees down to the essentials.
- Repeat-Until-SUCCESS – a new test step for robust retries.
- EasyInsert now finds AUTOSAR service methods and events.
- Project report workflows with PRFZ export and offline availability.
You'll also find new features for HiL, tool connections, test management, and trace analysis. Details on the following pages – enjoy reading on!
Highlights
ecu.test agent
End-to-end workflow from specification to test case to trace analysis
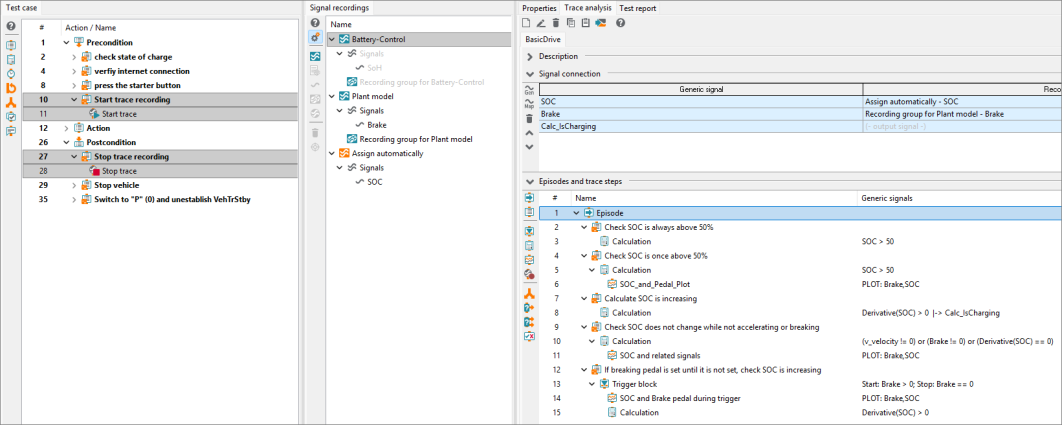
With the current release, the ecu.test agent completes the end-to-end, AI-powered creation of test cases. Based on a test case and trace analysis specification, the ecu.test agent now seamlessly handles all implementation steps – from test case generation and recording to trace analysis.
Tasks that previously required manual effort can now be fully handled by the ecu.test agent. Trace recording is supported by the test steps Start trace and Stop trace. When generating signals, the ecu.test agent relies on proven mechanisms for automatic signal group assignment.
The functionality for generating recordings and signals, which was not available in previous versions, is now an integral part of this end-to-end solution.
Agentic multimedia test steps
With the TouchInput test step, ecu.test already offers the ability to perform various actions (clicking, swiping, rotating, etc.) to interact with an HMI or a website. Until now, fixed coordinates had to be specified for this. With the Image-Read test step, expectations can be set for the content of images - however, these must match the reference 100%.
This approach is not particularly robust, especially when testing HMI elements— for example, the positions and sizes of elements change during the development process, and the manually created test cases must be laboriously adjusted.
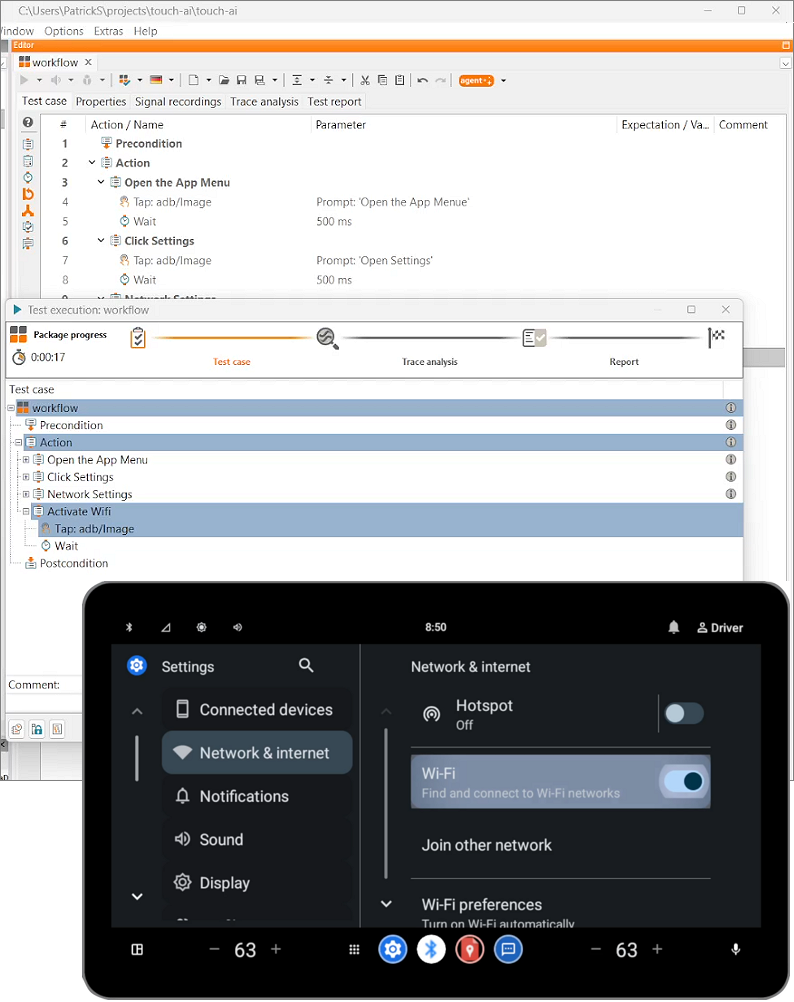
With the new AI feature in the Touch Input and Image Reading test steps, a prompt can simply be provided instead of coordinates. For testing an HMI, for example, the following prompts are possible:
- Press the “Radio” button.
- I want to make a phone call.
- I want to listen to music.
With the new image-reading feature, complex expectations can be set. Reference images can also be provided to the model:
- A blue Wi-Fi icon is visible in the upper-right corner.
- The reference image appears twice.
- The language in the image is Chinese.
The model analyzes the image - regardless of the language setting, the arrangement of the elements, or what is depicted in them. This allows for the creation of robust test steps.
The model is integrated via the ecu.test agent connector and can be tailored to individual needs. We have already had positive experiences with Claude 4.6 and ChatGPT.
ecu.test configuration
Selective tool restart when test bench parameters are changed
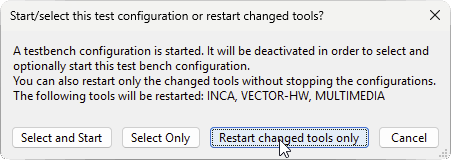
Depending on the tools used and the size of the databases to be loaded, starting an ecu.test configuration may take some time. Previously, as soon as a setting in an already started test bench configuration was changed, the entire configuration had to be restarted.
Starting with this version, when saving a test bench configuration (TBC), you will be asked whether only the changed tools should be restarted. This may be necessary, especially when setting up or modifying a test bench, and can lead to significant time savings.
Starting the configuration in offline mode
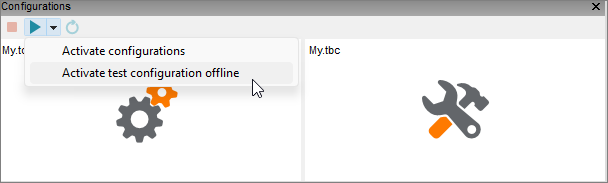
We improve test case creation in large teams by enabling ecu.test to utilize valuable testing resources as efficiently as possible. This allows more time to be spent on running tests and developing new ones in parallel.
To create a test case, the configuration must be started. Until then, this blocks the underlying resource (e.g., the HiL). Other users, as well as the ResourceAdapter from test.guide, cannot interact with the HiL during this time to, for example, run tests.
With the new offline mode, the configuration can now be started without blocking the test resource.
Note Some functions are not available in Offline Mode or are only available with restrictions. For example, no online requests are made. All restrictions can be found in the Help section.
Sneak Preview
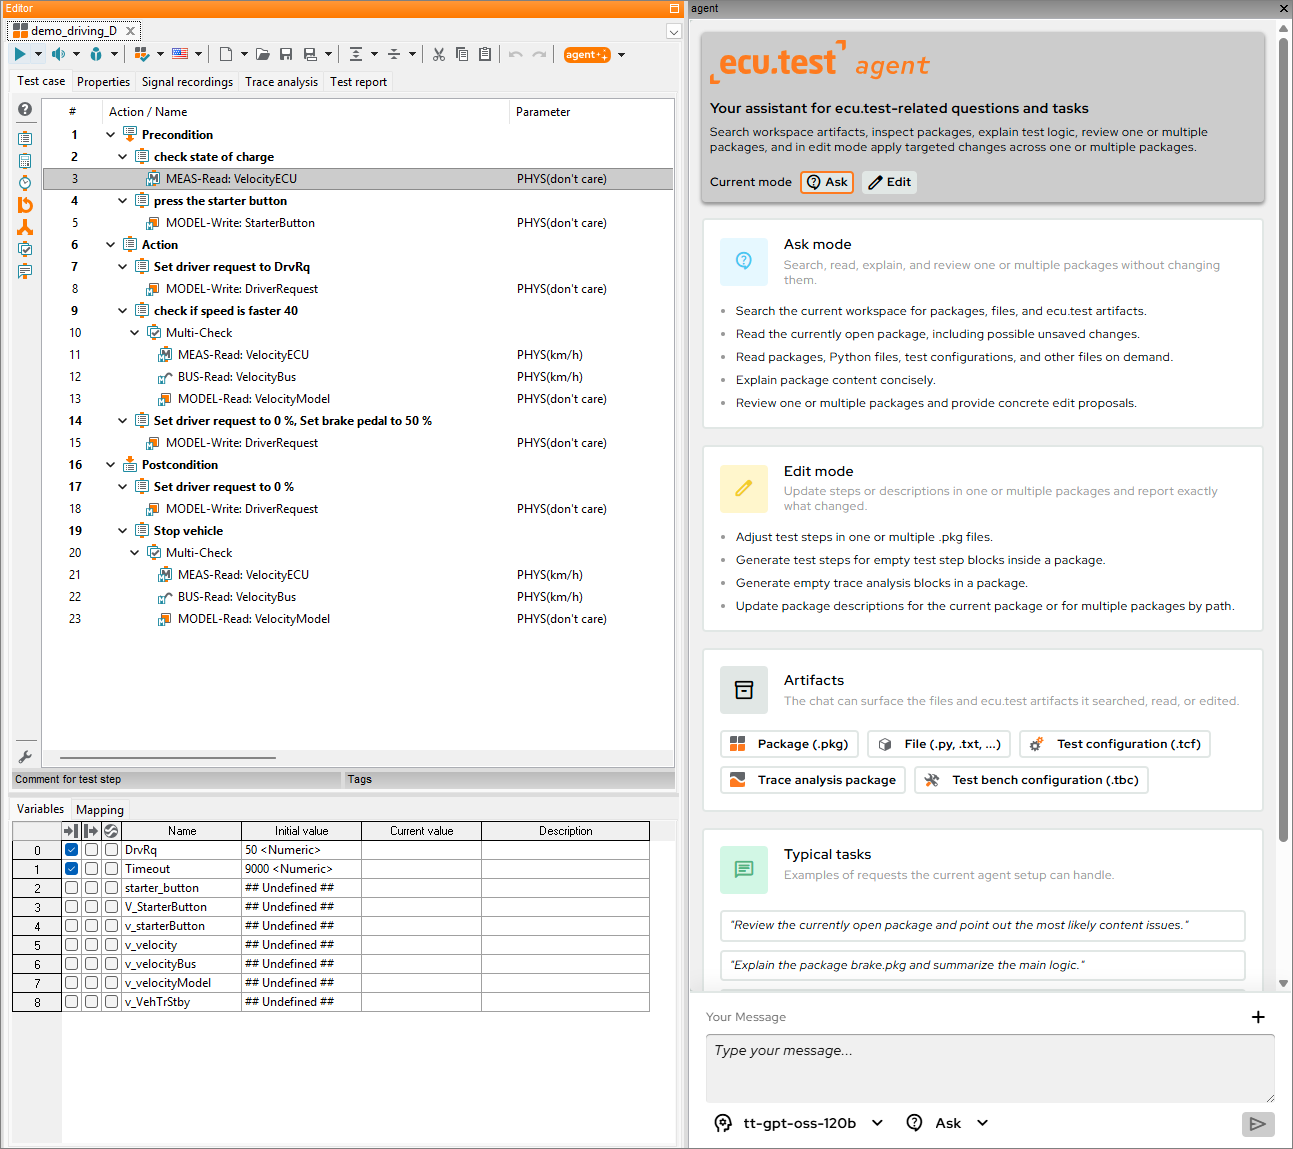
ecu.test agent chat
In recent releases, we have continuously refined and expanded the ecu.test agent. At the same time, we are already working on the next major feature: the ecu.test agent chat – an intelligent copilot that will provide support across a wide range of workflows in the future.
The ecu.test agent chat is already available on request in release 2026.2. Simply sign up by emailing support@tracetronic.com. We look forward to hearing from you!
Artifact compatibility between different versions of ecu.test
Updating ecu.test and workspaces will become significantly more seamless in the future. The goal is to enable different versions of ecu.test to run in parallel without interfering with one another, particularly in environments where multiple teams use a shared workspace, e.g., library workspaces.
A key problem today: As soon as a team checks in an artifact with a newer version, other teams still using an older version can no longer work with it. This creates pressure to roll out updates simultaneously and across the organization, which is hardly realistic in practice and leads to less frequent updates.
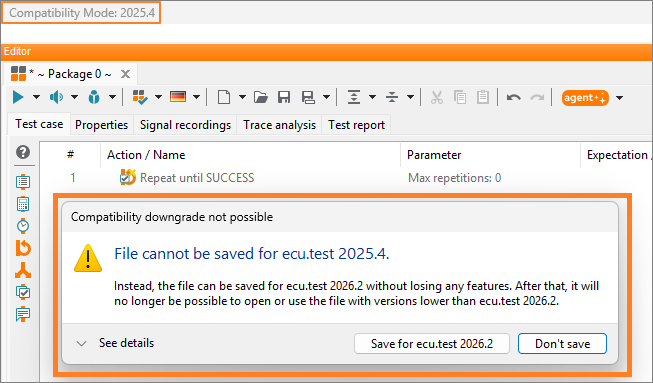
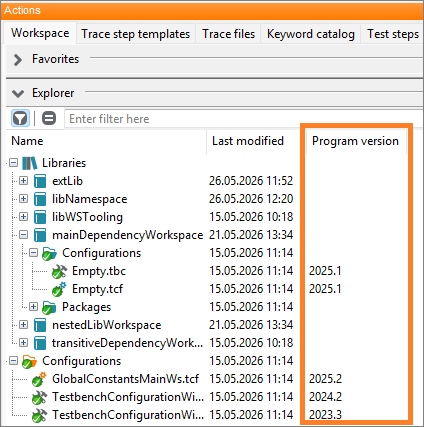
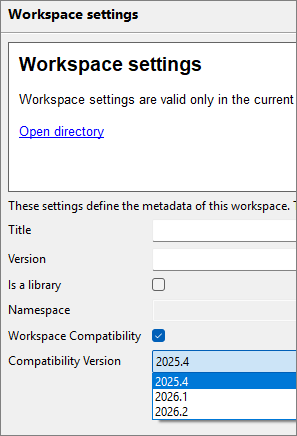
Starting with 2026.3, there will be a comprehensive check when saving artifacts, which operates based on an ecu.test target version set in the workspace. This prevents accidentally making artifacts incompatible with older ecu.test versions. The compatible ecu.test version is displayed in the Workspace Explorer.
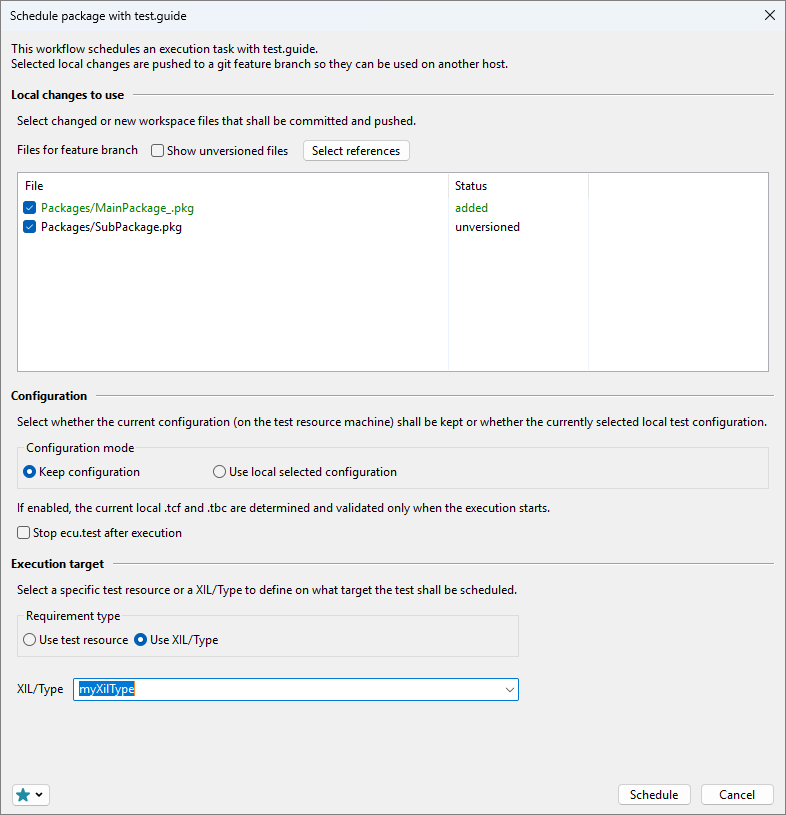
Executing local packages via test.guide
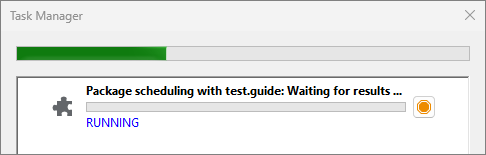
Soon, packages edited locally will be able to be tested directly via the test.guide execution distribution. This offers the following advantages:
- Git-based workflow
- Local editing without a test bench using the newly introduced offline mode of the test configuration
- Flexible execution that does not unnecessarily block test benches
- Prompt feedback on test case results while you can continue working
ecu.test extras
ecu.test agent
Global mapping for trace analysis signals
The ecu.test agent now also takes global mapping signals into account. It adds relevant mappings to signal groups and generates the generic trace analysis signals. This is a major step toward fully executable packages with trace analysis.
ecu.test calibration
Automatic connection check and reconnect for XCP-Slave Access
A new option is now available that automatically checks the connection to the XCP-Slave before every read or write operation. If the option is enabled, the system checks the connection status to the XCP-Slave before every read/write operation. If it is detected that the connection is no longer active, a reconnect attempt is made automatically. If this is successful:
- all buffers are cleared.
- the last-used calibration page is restored.
- measurements and recordings are resumed.
- and the actual test step is then executed.
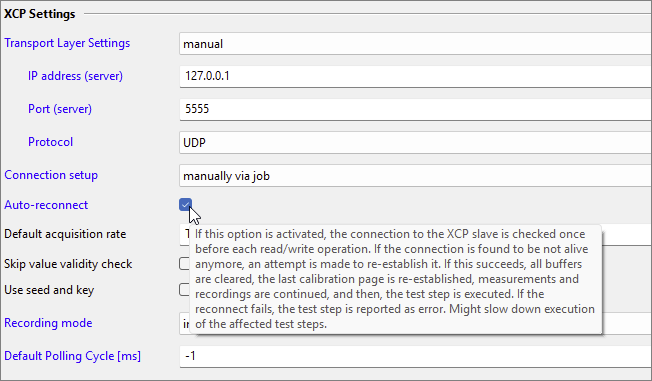
Behavior if the reconnect fails
If the reconnection attempt fails, the system behaves as follows: Read test steps return the status ~NotPresent~, and write test steps are reported as errors.
Note The additional connection check may slightly increase the execution time of the affected test steps. The function should therefore be enabled specifically where increased robustness of XCP communication is required.
ecu.test code
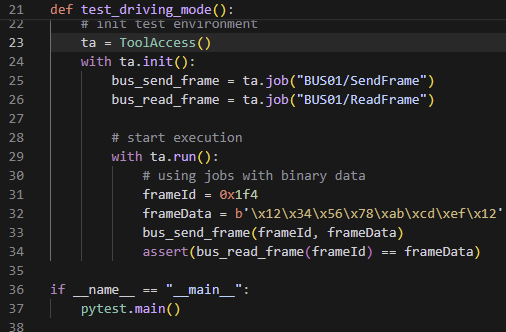
Support for "bytes"
For certain test steps and jobs, ecu.test provides the ByteStream data type. This allows byte sequences to be parameterized, calculated, and evaluated. This data type is specific to ecu.test and does not exist in ecu.test code.
Wherever ByteStream is required in ecu.test, the Python base data type bytes can now be used from within ecu.test code. This enables a wide range of test steps, such as the SendFrame() and ReadFrame() jobs, to access bus hardware generically.
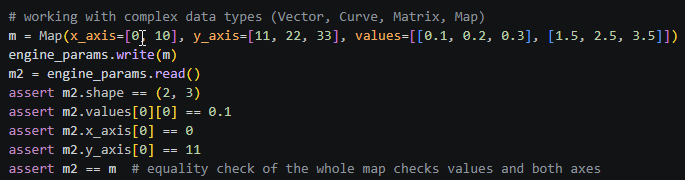
Support for Vector, Matrix, Curve, and Map data structures
Similar to bytes, ecu.test code now also supports nested lists for complex data structures, which are represented in ecu.test as Vector, Matrix, Curve, and Map. This is available for job calls and read and write test steps.
Support for constants in pytest
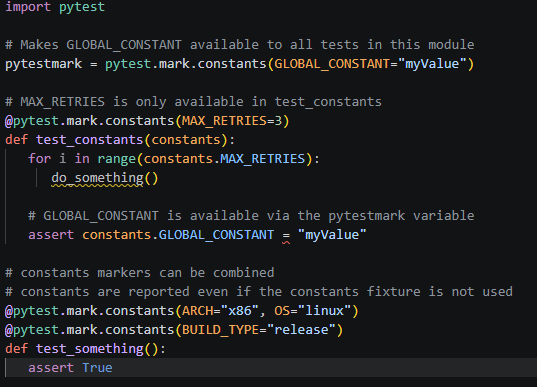
To improve the maintainability, readability, and clarity of test cases, it can be useful to use constants that are defined in a central location. This can now be achieved using the marke:
- pytest.mark.constants(...)
The marker accepts keyword arguments and can either be applied to a test function or test class via a decorator or used at the module level by setting pytestmark.
Additionally, the fixture constants provide the constants set via pytest.mark.constants(...) as attributes for use within the test.
When uploads to test.guide are enabled, all constants are transferred to test.guide and documented there.
ecu.test diagnostics
Extensive DiagBrowser Enhancements
To facilitate the creation of diagnostic test steps and interaction with the loaded diagnostic database (e.g., the ODX), the DiagBrowser has been enhanced with numerous API methods.
- DecodeUdsRequest: for decoding a diagnostic payload into a human-readable structure
- EncodeUdsRequest: for encoding a structure into a diagnostic payload
- GetSubfunction: for reading the subfunction (if available)
- GetId: for reading the DID/RID of the service (if available)
- GetDescription: for reading the description stored in the database
Further information can be found in the API Help.
ecu.test drive
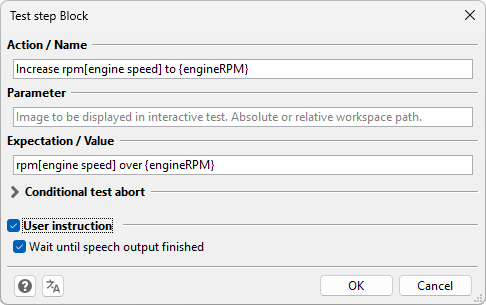
Synchronous/asynchronous and alternative voice output for block test steps
Previously, it was only possible to decide globally for all block test steps whether to proceed with the execution of the contained code before the instructions were read aloud.
Now, this setting can be configured individually for each block, allowing for greater flexibility when creating interactive test cases.
Additionally, an alternative text can be appended to a word in square brackets, which is then read aloud in drive instead of the actual word. This enables a compact textual representation while maintaining clear and understandable voice output.
Support for ecu.test on Linux with and without a GUI
ecu.test drive can now also be used with ecu.test running on Linux. It does not matter whether the version with a user interface or the runner is used.
Test execution in drive no longer triggers interactive execution in ecu.test
Previously, a test execution triggered in drive always resulted in an interactive execution in the ecu.test interface. This led to duplicate displays, potentially duplicate read-aloud instructions, and synchronization issues between drive and the test execution.
Therefore, we have decoupled the two interactive execution modes. A test execution triggered in drive is no longer displayed interactively in ecu.test. Control is therefore handled exclusively via drive.
Interactive execution from within ecu.test using the integrated interactive interface is still possible.
ecu.test lab
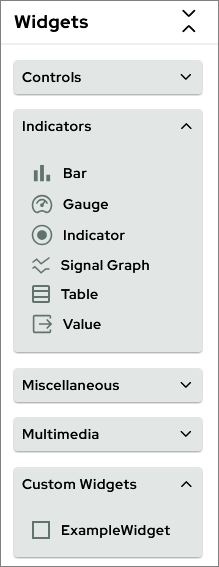
Widgets are now presented in a clearer, grouped format for insertion
Previously, the various widgets were displayed only as icons with tooltips. This made it easy to lose track of them, especially when using Custom widgets extensively.
Now, the name of each widget is displayed, and they are organized into groups.
For Custom widgets, you can specify your own groups and thus organize them into groups based on any criteria you choose.
Copying and Pasting Widgets
You can now copy widgets using Ctrl+C, just as you would in other applications, and paste them using Ctrl+V anywhere you like. Including on other pages within the same view or in a different view.
Note The previous workflow of using Ctrl+Drag to duplicate widgets is no longer necessary.
Interacting with widgets now requires Live Mode
Previously, it was possible to trigger individual actions on some widgets even without Monitoring Mode.
However, since all other widgets were not updated in this workflow, this approach offered little added value and regularly caused confusion among users who had forgotten to activate Monitoring Mode.
From now on, widgets can no longer be operated without starting the mode, which has now been renamed Live Mode. A notification will appear if you attempt to operate a widget without starting the Live Mode.
To continue accommodating use cases where information should only be updated on demand, the polling rate is now optional for all widgets. If it is disabled, a refresh button automatically appears in the upper-right corner of the widget. Clicking it triggers a one-time update of the widget’s state.

Improved Management and Availability of Views and Pages
Previously, Pages from referenced workspaces could be integrated using the Page Reference widget. Now, a view provided via a workspace can be used in its entirety.
Editing is not possible in this case. Control over the content provided remains with the creator of the view within the context of the library workspace.
In addition, individual views are now stored in separate files under:
<workspace>/lab/views
This allows for easier distribution and management of views and contributes to robustness in the event of errors in individual views.
Extensions for Custom Widgets
Signals can now be defined in widget.json with a minimum count of 0. This allows you to create widgets with optional signals.
The WidgetAPI now offers a GetFile method that allows the contents of a file to be read from the directory
<workspace>/lab/shared/
This means, for example, that more extensive parameterization or specifications for the widget can be provided as a separate artifact in the workspace and referenced by the widget.
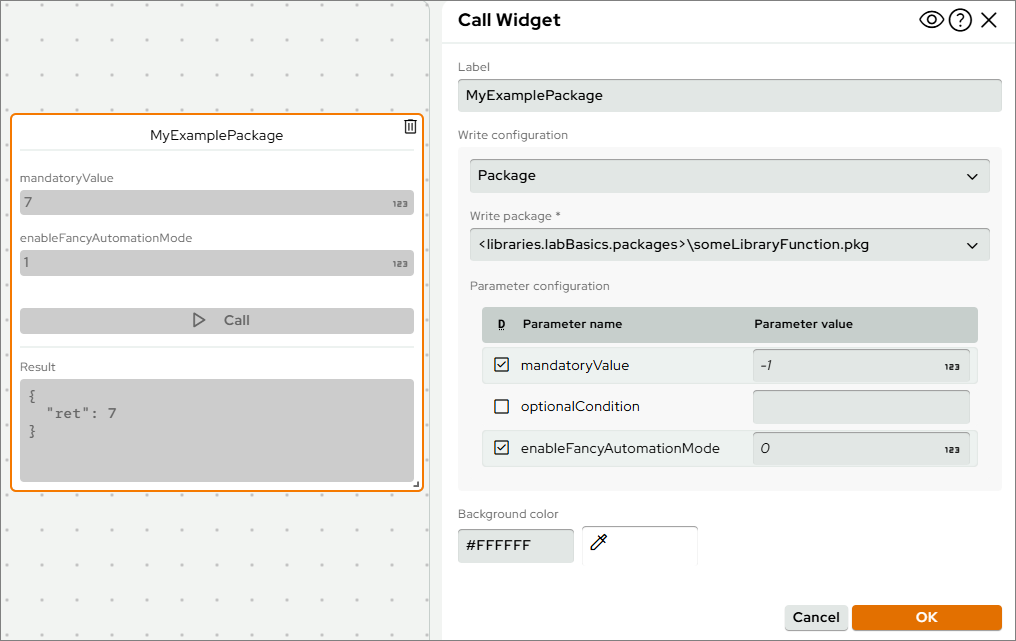
Package execution via the Call widget
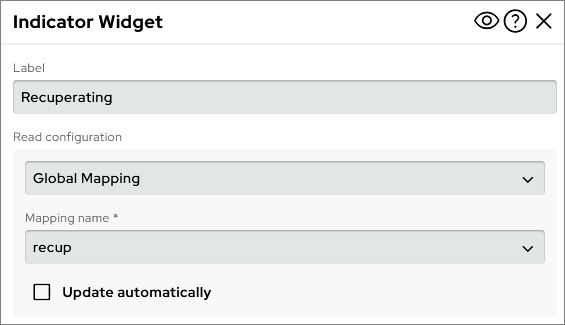
Multiple parameters can be set, and all return values are visible. Ideal for more complex status changes or queries.
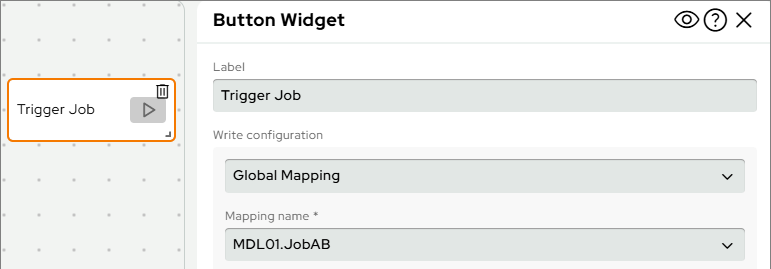
Job execution in all mapping capable Widgets
Jobs can now be executed as an alternative to direct signal access, allowing for more direct interaction with tools and ports. Cyclic execution is also supported.
Direct Interaction with Images in the Image and Video Widgets
Clicking directly on the displayed image or video can trigger the execution of a package that is configured with the corresponding pixel coordinates. Within the package, the system can be stimulated however necessary.
This enables direct interaction with the displayed screen content.
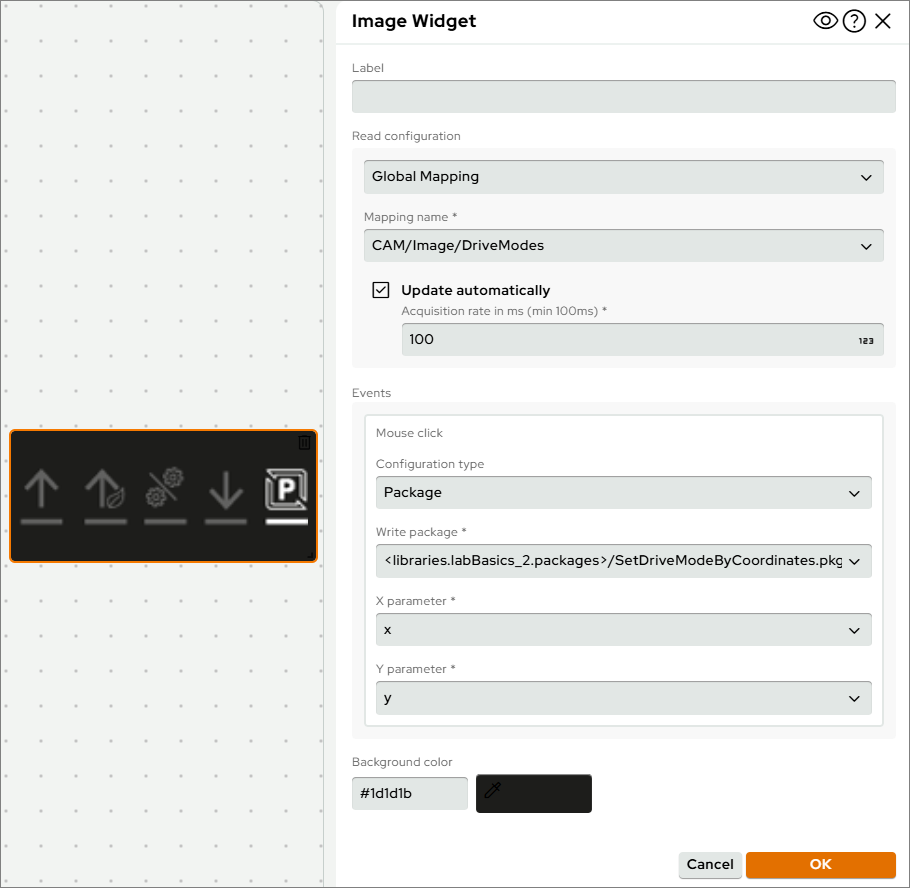
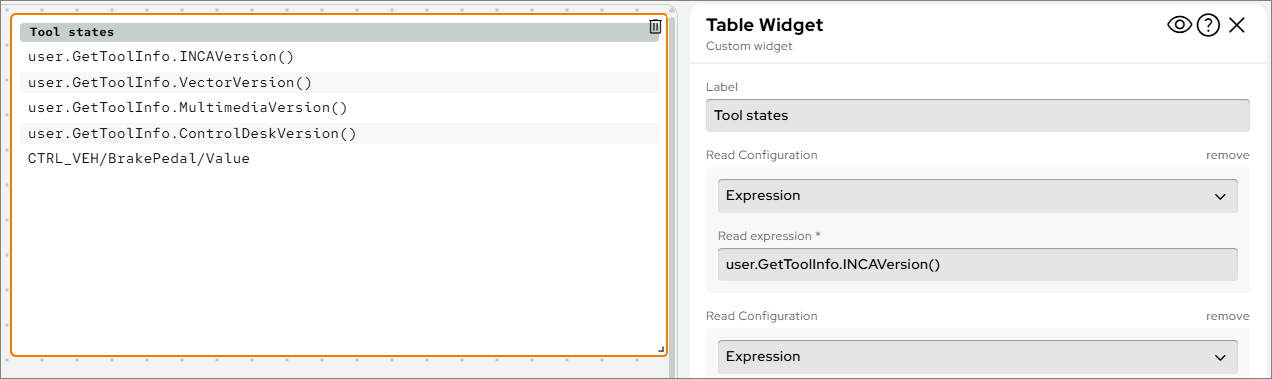
Table Widget
Until now, creating a compact list of values was only possible using a custom widget. With the "Table" widget, we now offer this feature directly.
Usability
Improvements to the ecu.test Linux GUI
Following the release of the ecu.test GUI for Linux with ecu.test 2026.1, there are several new features and improvements for Linux users:
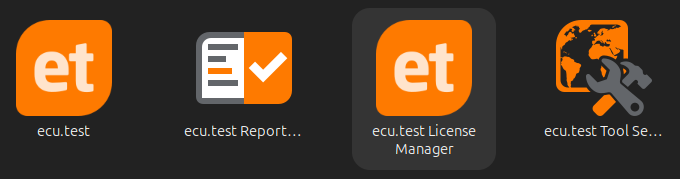
- The license manager is now also available as a GUI, so that all necessary license settings can be accessed without using a configuration file or environment variables.
- The tool server is now installed with a start menu icon, similar to ecu.test.
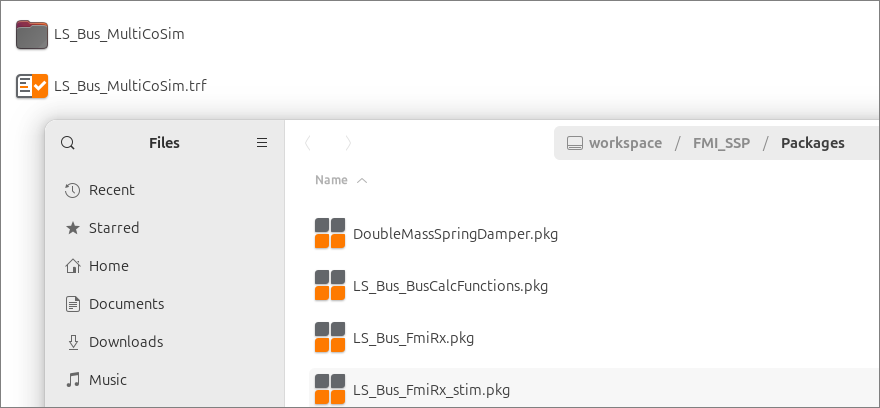
- ecu.test artifacts such as packages or reports are linked to ecu.test, so they have the icons familiar from Windows and open directly when double-clicked.
Library workspaces: Support for templates and report generators
Library workspaces in ecu.test now also support the usage of templates for projects, packages, and analysis packages.
These are stored as usual in the workspace’s Templates directory and are then available in the local workspace.

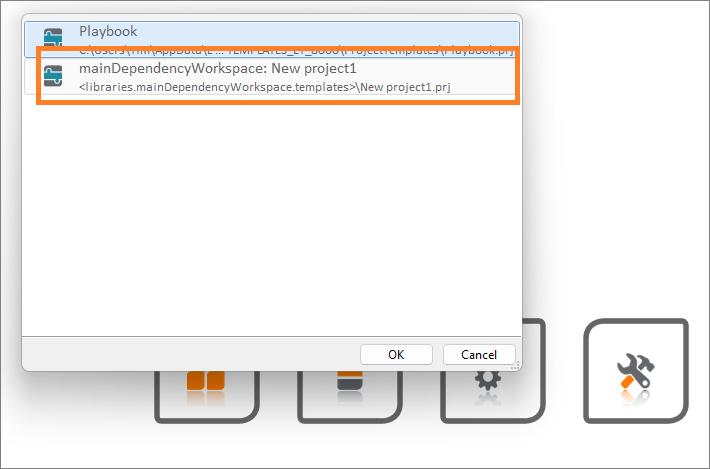
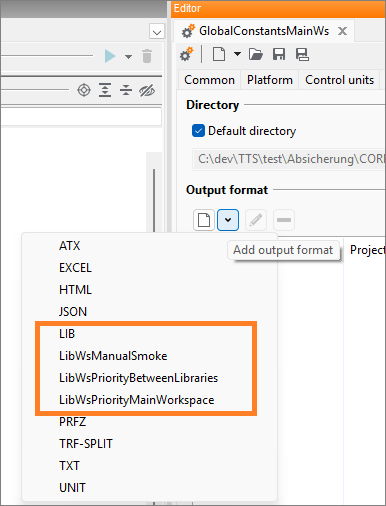
In addition, report generators can now be used in library workspaces and selected in a TCF.
Library workspaces: Displaying the Git branch
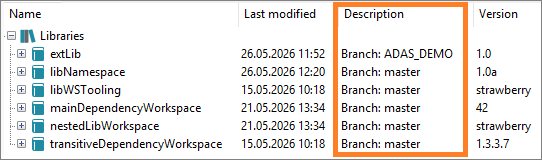
The active Git branch of a library workspace is now displayed in the Description column, so that the branch being used is immediately apparent.
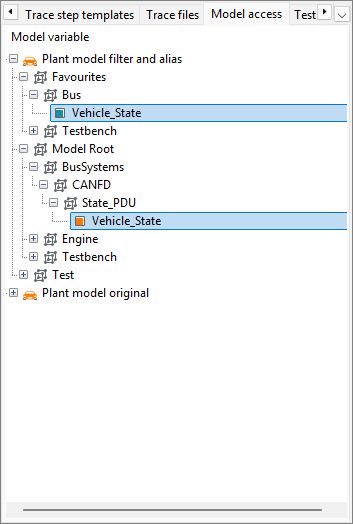
Custom Restructuring of Model Variables
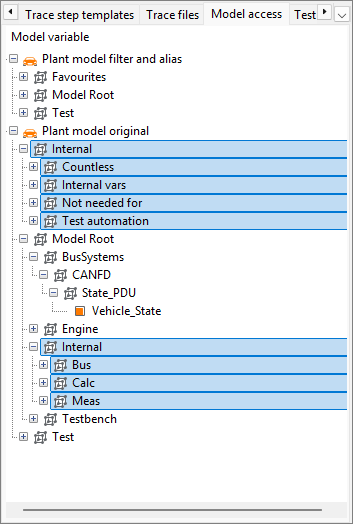
Some models are enormous in size—in some cases, they contain hundreds of thousands of variables. Typically, only a small subset is needed in a test case— yet the entire model is always loaded.
Furthermore, it can happen that model sizes shift within the structure during a version jump. In this case, the mapping is no longer valid and must be laboriously updated in the test cases.
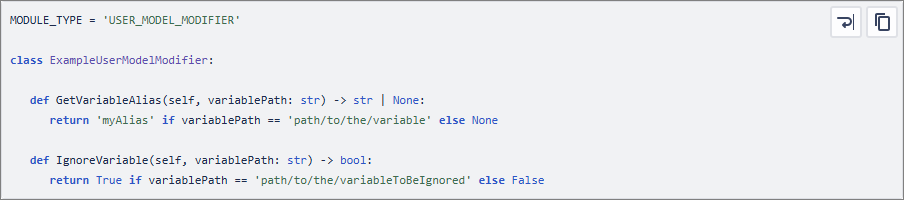
With ecu.test 2026.2, a user script can be attached to the model in the TCF, in which user-defined filters and aliases are applied. Using simple Python logic, model trees can thus be reduced to the essentials or new views created for specific model sizes.
Further information and examples can be found in the User manual (Model access tab).
 |
 |
|---|---|
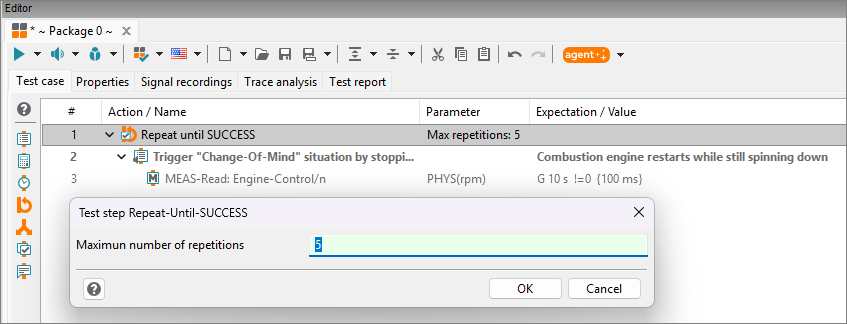
New "Repeat-Until-SUCCESS" test step
In uncontrollable environments, particularly during manual testing in a vehicle, it may be necessary to repeat a test sequence multiple times to achieve a specific system state. This repeat option eliminates the need to completely abort and restart the test case.
The new Repeat-Until-SUCCESS test step enables precisely this repeated execution of a sequence of test steps until their overall evaluation is SUCCESS or a maximum number of attempts has been reached.
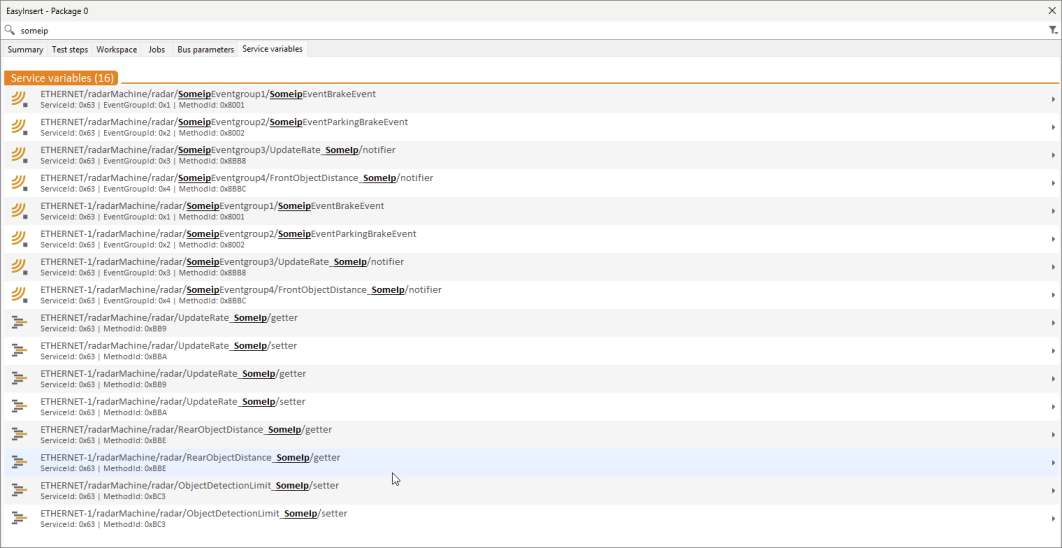
Quick search for Service methods and events
Starting immediately, the ecu.test search mechanism EasyInsert (Ctrl+Space) allows you to quickly and easily search for and find service methods and events based on AUTOSAR description files.
System certificates for HTTPS connections
When establishing encrypted server connections (HTTPS), certificates from the system certificate store are now used to verify the trustworthiness of the connection. This does not apply to custom implementations.
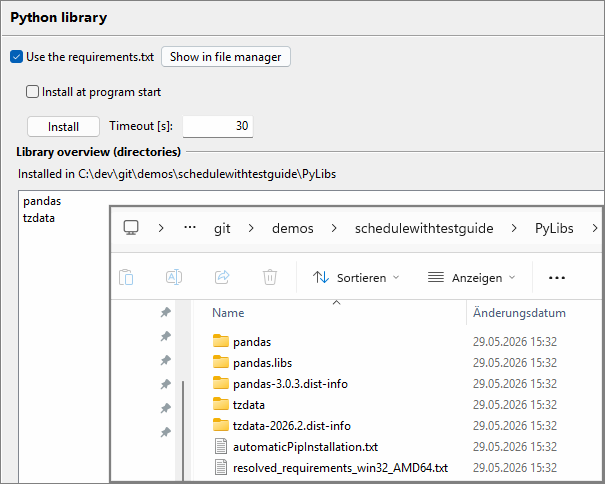
Improved performance when resolving Python dependencies
Resolving and installing Python dependencies via the requirements.txt file has been significantly improved and, thanks to a workspace- and platform-dependent caching mechanism, offers much better performance.
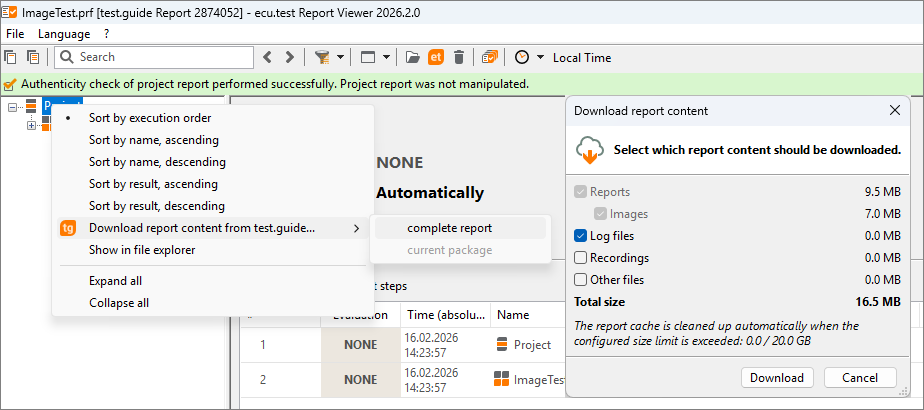
Extend project report workflows.
The PRFZ Export is now available as a report generator.
When opening a report from test.guide, the download processes have also been improved:
- Downloading multiple files now occurs in the background and includes a central progress bar.
- Desired report artifacts, such as recordings, can now be downloaded directly via the context menu in the report tree.
- This allows a report to be made fully available offline.
- Additional downloads when clicking on a subreport are no longer necessary.
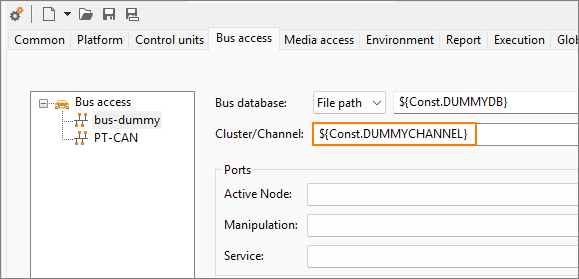
Test configuration: Specifying constants in the bus channel selection
For bus or service description files, such as AUTOSAR XML, it is necessary to select the communication cluster. To be able to reuse an ecu.test test configuration for different bus configurations, it may be necessary to configure the cluster.
Starting now, global constants can be specified for this purpose in the test configuration input field.
New tutorial for Getting Started with ecu.test
The introductory chapters of the documentation have been consolidated, updated, and expanded into a comprehensive tutorial that covers the content of the previous Basic Training course. It is designed for new users and provides a direct, hands-on introduction using the included sample artifacts and practice projects.
The tutorial is designed as a self-guided introduction and provides a step-by-step guide to the fundamental concepts and workflows in ecu.test. The chapters will be continuously expanded in future releases.
For more complex use cases or in-depth training, individual training sessions are still available, which can be tailored to specific tools, projects, and questions.
Test aspects
HiL
High-performance processing of bus communication from ASAM CMP, PLP, and TECMP Ethernet logger data streams
In ecu.test, communication from classic buses such as CAN (-FD), FlexRay, and LIN can also be extracted from bundled logger data streams. Processing performance has been significantly increased with this release. This allows ecu.test to record traces and read signals without loss, even with data rates in the gigabit range.
This enhancement does not need to be enabled and is automatically applied to all Ethernet bus capture protocols.
Additional protocols that can be passively analyzed in test cases, such as DLT and SOME/IP, will be migrated to the new technology in the next release.
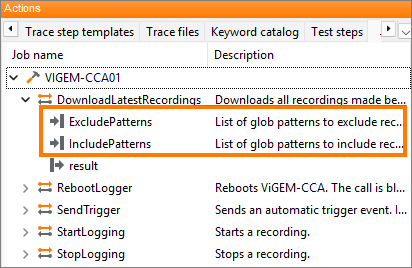
ViGEM (CCA): File Filters for DownloadLatestRecordings
The “DownloadLatestRecordings” job for ViGEM now supports filtering using include and exclude patterns (glob syntax). This allows you to specifically include or exclude certain files and folders during the download. This makes it easier, for example, to exclude large files such as MIPI videos. If no patterns are set, the behavior remains the same as before.
Star Electronics FL3X RBS: New tool integration
With this release, a new tool, FL3X, is now available in ecu.test.
It enables the integration of the FlexDevice family from Star Electronics as bus manipulation hardware, thereby expanding the capabilities for bus simulation and signal manipulation in automated test sequences.
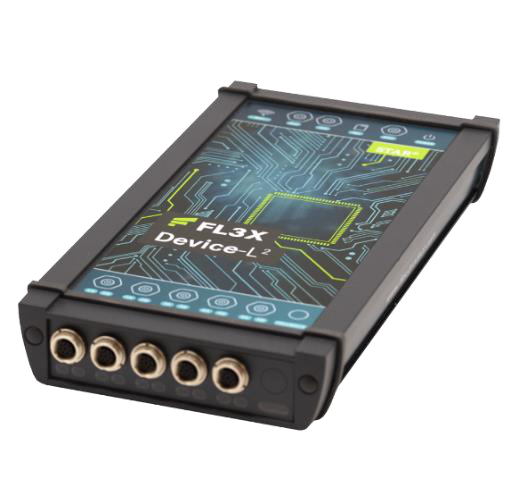
The new tool provides a bus manipulation port and offers bus-independent access to all classic bus systems (CAN, LIN, FlexRay). In particular, the following are supported:
- Writing and manipulating signals by setting fixed values, freeze, offset, as well as factor, ramp, and drift manipulations
- Application of signal manipulations optionally
- Enabling and disabling individual messages
- Access to global variables of the FlexDevice via jobs
Test management
Jama Connect - Attribute handling and export
The example workflow now uses the new Object API to generate Attribute Specification files. Attributes aren’t just pulled from Jama into ecu.test anymore; they can be set or changed right inside a package or project on the ecu.test side.
Exporting packages from ecu.test back into Jama is supported too, and any mandatory attributes can be set up in the Package before you hit export.
Codebeamer 3 Support
As Codebeamer 2.x reaches its end of live support, we have updated the example workflow and the Tracetronic Codebeamer library to be compatible with Codebeamer 3. This ensures continued functionality and takes advantage of the new platform’s features.
Trace analysis
Improved autocompletion and type hints in external IDEs
The interfaces provided for NumPy trace step templates have been updated to ensure that autocompletion and type hints work immediately after they are included, for example in VS Code.
The user guide has been expanded to include instructions for proper setup in VS Code and PyCharm.
Support for ZSTD compression in MDF 4.3
The MDF 4.3 standard was published in September 2025. In the meantime, the first tools are beginning to implement parts of the standard. With ecu.test 2026.2, reading ZSTD-compressed signal data is now supported.
Parallel analysis job processing: Improved performance on Windows
On Windows, project execution with parallel analysis job processing benefits from faster execution.
trace.xplorer
Instantly update the context of trace steps from reports in trace.xplorer
Many users wanted to be able to switch between the contexts of individual trace steps more quickly when evaluating reports. Until now, for each new trace step, users had to close the trace.xplorer, select the next trace step in the report, and then reopen the trace.xplorer. The previously displayed trace section (scroll position and zoom level) was lost in the process and had to be restored manually. This workflow required many clicks and created a lot of visual clutter on the screen.
To improve the situation, the report views in ecu.test and the Report Viewer now work more closely with the trace.xplorer.
When launched from within a report, it continues to display the signals involved in the current trace step, as well as any evaluations generated. However, if you select a different trace step, the open trace.xplorer instance and the displayed trace section are now retained. Only the visualized trace step context - that is, the displayed signals and evaluations - is updated.
This makes it possible to analyze the report information much more efficiently than before, especially when using multiple monitors.
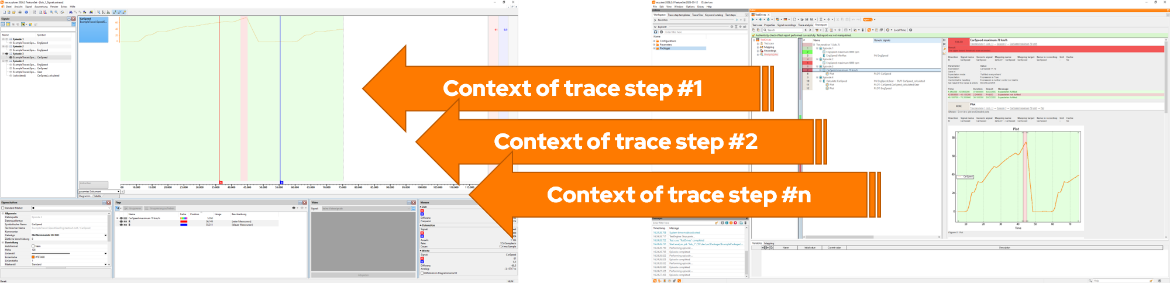
The new Test Report toolbar allows you to access the caller's report view (ecu.test or Report Viewer) with a single click. You can also enable or disable the automatic updating of context information as needed.

Importing raw values from MDF4
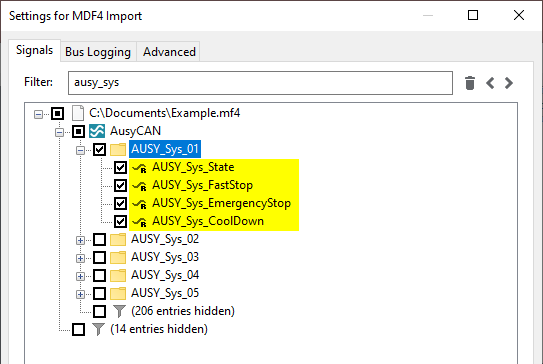
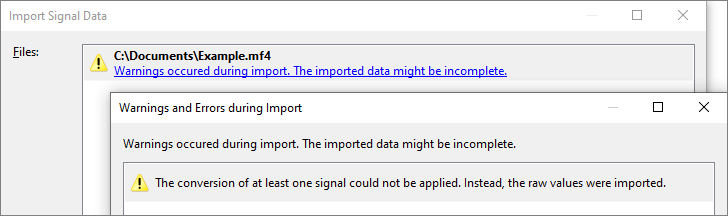
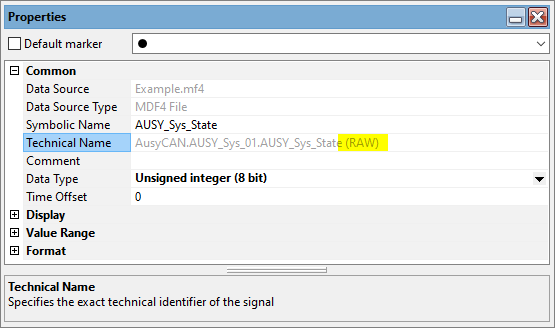
When importing signals from MDF4 trace files, certain signals may not appear in the selection list even though ecu.test shows them.
One possible cause has been resolved: The MDF4 import filter now also allows the import of signals whose raw values cannot be converted to physical values because the conversion rule used is not supported. In such cases, the raw values are imported instead of the physical signal values.
Note A trace.xplorer license is required to use this feature.
Find changes in signal values quickly
Previously, when searching for sampling points at which a signal’s value changed, users could only specify a search condition for Boolean signals to look for rising or falling edges. Now, a new comparison operation value change is available for all signal data types to identify any changes in signal values. Interruptions within the signal (data gaps) are also considered changes in this context.
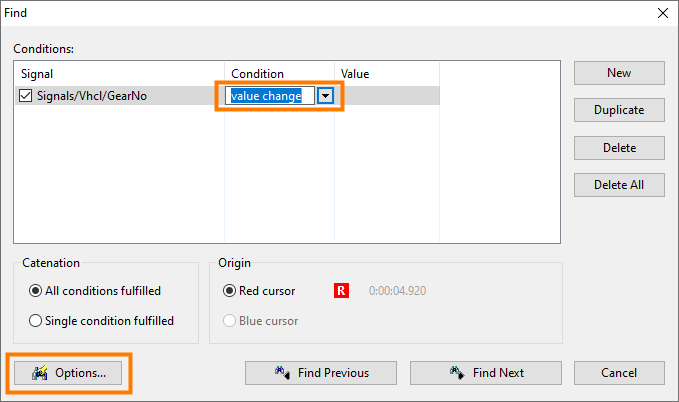
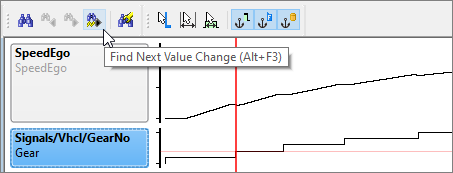
To make the best use of this search function, it is available via the Find toolbar and the shortcut Alt+F3. Using either of these methods searches for changes in the active (dashed-bordered) signal and places the red cursor at matching locations.
Search options such as resuming the search at document boundaries are taken into account. The search options have therefore been moved to a separate dialog, which can also be opened via the toolbar.
Note A trace.xplorer license is required to use this feature.
Minor usability improvements
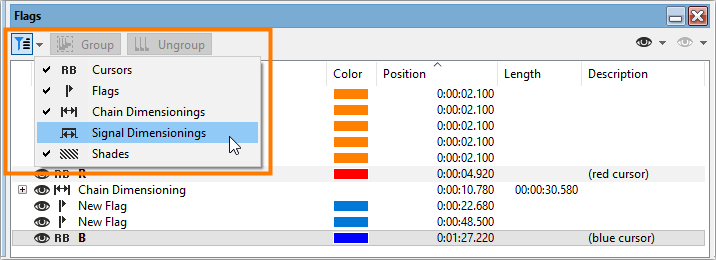
The flag list sometimes contains a large number of entries for markers (cursors, flags, chain and signal dimensionings, shades), all of which are visualized in different ways in the views. It is easy to lose the overview - both in the list and in the views.
To help you keep your focus, the flag list now provides a new button in its toolbar for filtering entries by type. A context menu allows you to control which markers remain visible when filtering is active. Filtering affects only the flag list, not the views.
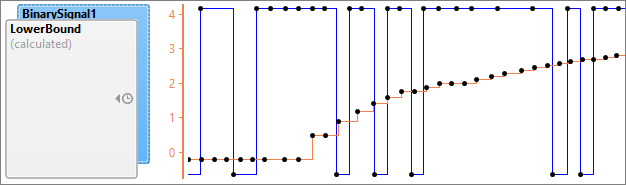
When investigating the cause of a failed test, it can be essential to know the sampling points of a signal, especially for signals that are sampled infrequently. trace.xplorer now allows you to display sample markers with a single click.
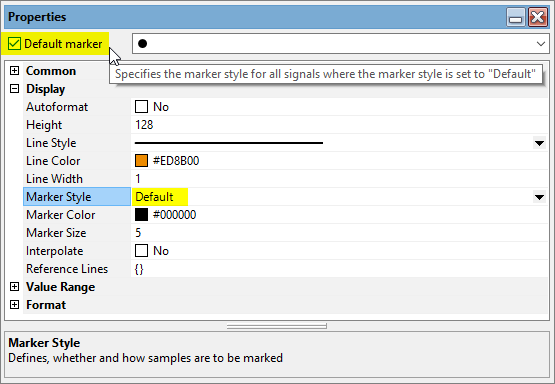
If the new Default marker option is enabled in the Properties toolbox, the samples of all signal curves for which the Default marker style is set will be indicated with the selected marker symbol. Signals that already have a specific marker style are not affected.
Whether and how samples are marked by default is a user setting that applies to all documents.
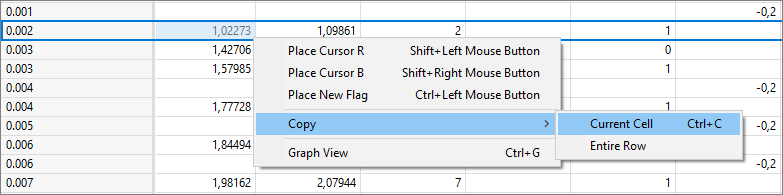
The existing options for copying content from the table view to the clipboard have been expanded. Until now, it was already possible to copy data from the current cell (new shortcut Ctrl+C) as well as from a single row.
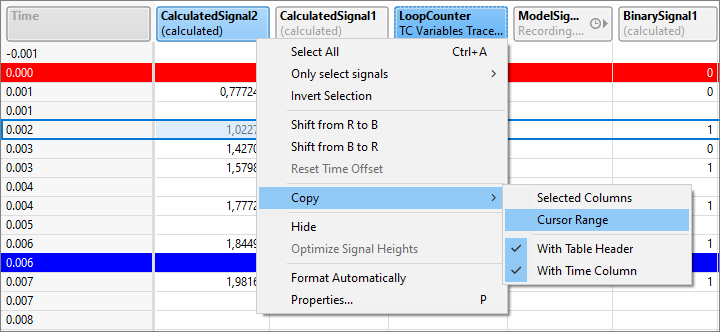
The context menu of the signal headers now offers additional commands for copying entire signals. Selected columns can be copied either completely or only the time range marked by the cursors. Two options allow you to specify whether the table header and the time column should also be included.
Further test aspects
Optimization of the ecu.test Linux Runner Installer
The DEB package and the UBI9 image have been significantly reduced in size, so they now take up considerably less space both during download and installation. Among other things, the help files stored within them, as well as other components irrelevant to console execution, have been removed. Full compatibility remains guaranteed.
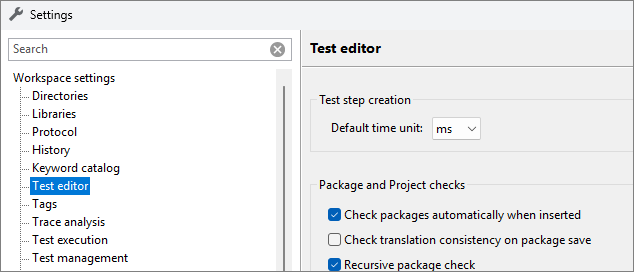
Default unit for time estimates via Workspace settings
In the Workspace settings, you can configure the default unit for times in newly created test steps. This allows you to specify values in seconds instead of milliseconds for key parts of the test case, such as time expectations and wait steps.
Name recorded files by signal group by default
Attention The default name for generated recording files has been changed!
Recordings are now named according to their signal group instead of being numbered anonymously. This makes it much easier to identify bus recordings such as A-CAN.asc in the file system.
Improvements to the Default Recording Configuration
The default recording configuration enables centralized management of signal and recording groups and their settings. This makes the actual test cases much clearer and faster to create.
The user guide has been expanded and now provides detailed information on the configuration options. Both a feature-oriented table and use-case-specific examples are provided to assist with this.
Usability has also been further improved. For example, signals are added to the Auto-Assign group by default if a default recording configuration is loaded (instead of potentially creating individual signal groups). Additionally, an activated Trace Merge is now applied, and the Package Check now correctly takes the default recording configuration into account.
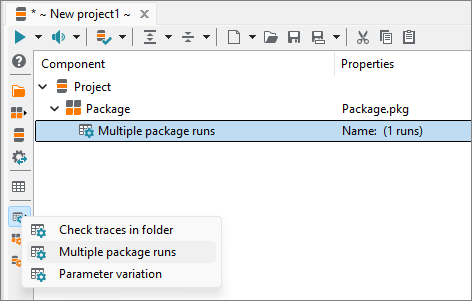
Standard parameter set generator for x iterations
A new parameter set generator allows a package to be executed the desired number of times.
Versions and interfaces
New tools and versions
| Provider | Web site | System | Product name | Version | |
|---|---|---|---|---|---|
| 1 | IPG | Release link | The simulation solution for virtual driving tests | CarMaker | 15 |
| 2 | MathWorks | Release link | Platform for programming and numerical calculations | MATLAB/ Simulink | R2025b unter Linux |
| 3 | Vector | Release link | Open simulation environment for virtual test driving of cars and commercial vehicles | DYNA4 | R9 und R10 |
APIs
Object API
New methods for manipulating pkgattr.spec and prjattr.spec
Until now, package and project attribute specifications could only be adjusted by manually modifying the files. However, user-defined test management adapters require automatic derivation and modification of attributes from the ALM.
The new Object API AttributeSpecApi enables program-controlled reading, modification, and saving of attributes. This allows for dynamic synchronization with the ALM, reduces manual effort, and increases the consistency of test data.
REST API
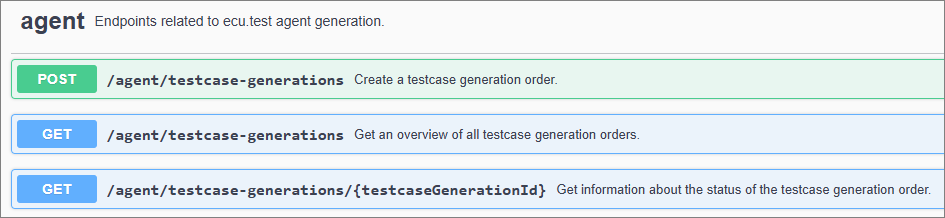
New endpoints for test case generation with the ecu.test agent
New REST API endpoints are now available for generating test cases using the ecu.test agent. Generations can be scheduled, and their generation status can be checked.
Discontinuations
Discontinued features and incompatibilities in this version
KS: Tornado only via ASAM ACI
The tool connection has been removed. It will be replaced by the new connection based on ASAM ACI, which is available since ecu.test 2023.3.
Interface TmUserAdapter - Removal of methods
The following interface methods of the Test Management UserAdapter have been removed:
- GetPackageFromTms
- GetProjectsFromTms
Use the following new methods instead:
- FetchChildrenForPackageImport
- FetchChildrenForProjectImport
Jama Connect - Integrated adapter
The integrated test management adapter for Jama Connect has been removed. As a replacement the user defined test management adapters can be used. These adapters offer significantly more flexibility and enable optimal adaptation to the respective workflow.
A sample workflow is provided to assist with your own implementation.
Jobs RequestSeed and SendKey
In order to provide native support for the UDS Service Security Access using the SeedAndKey DLL in ecu.test, the obsolete RequestSeed and SendKey jobs have been replaced.
- RequestSeed → SecurityAccessRequestSeed
- SendKey → SecurityAccessSendKey
The new names are now more adjacent to the UDS specification.
Compatibility
The new jobs have the same capabilities like the old ones. They also support SeedAndKey DLLs.
Affects
If you use the old jobs, you need to switch to the new ones.
Port start option: NEVER
In the test bench configuration, there was a Never startup option for a port to prevent the port from being activated when the test case starts. In the past, this option has caused some confusion.
Compatibility
Since there is no known use case for explicitly choosing not to start a port, the option has been removed. Configurations that used this option are now automatically updated to the IF NECESSARY startup option.
Affects
The change should not have any noticeable impact. It is recommended that you always use the IF NECESSARY startup option.
Discontinued features in future versions
Tektronix UTA 12
The tool is no longer available on the market and and will be discontinued in ecu.test 2026.4.
QUANCOM
The QLIB API interface for Quancom is no longer compatible with current devices and and will be discontinued in ecu.test 2026.4.
Fibex support
Fibex support for bus is being deprecated and will be removed in ecu.test 2026.3. Fibex support for DLT will remain available.
TRF files can no longer be generated for project reports
With the introduction of the PRF format for project reports, the TRF format has become obsolete. Although the TRF format could be activated via the workspace settings during the migration phase, this fallback setting is expected to be removed in ecu.test 2026.3. Until then, based on feedback received, work is underway to improve some workflows with and without test.guide.
This discontinuation only affects project reports. Package executions will continue to be saved in the TRF format.
Import in connection with CustomChecks
Custom tests may use a module that has been moved. Therefore, check the imports and adjust them if necessary. The discontinuation will take effect with ecu.test 2026.3.
- old: tts.core.common.check.Constants
- new: tts.interface.customCheck.Constants
Real-time package references
dSPACE has changed its interface for controlling the real-time environment with ControlDesk 2024-B. Since this dSPACE release, it is no longer possible to execute real-time package references with ecu.test.
Due to the lack of user feedback on this issue, we assume that this feature is rarely used and will remove it with ecu.test 2026.3.
Attention The discontinuation only applies to real-time package references. Other features related to real-time testing (RTT) are not affected.
Bus monitoring test steps
The bus monitoring test steps used to check timings and DLC can be implemented much more effectively with trace analysis and the provided analysis modules.
Starting with ecu.test 2026.3, support for inserting new test steps will be discontinued. Support for execution will be removed in ecu.test 2027.1 at the earliest.
Basler: Pylon
Basler cameras are compatible with the GenICam standard, which eliminates the need for a separate tool connection. For this reason, the Basler: Pylon tool will be removed from ecu.test 2026.3.
When using a Basler camera, the GenICam tool connection can be used as an alternative.
Siemens Polarion
The integrated test management adapter for Siemens Polarion will be removed with ecu.test 2027.1.
As a replacement the user defined test management adapters can be used. These adapters offer significantly more flexibility and enable optimal adaptation to the respective workflow. A sample workflow is provided to assist with your own implementation.
IBM Rational Quality Manager (RQM)
The integrated test management adapter for IBM Rational Quality Manager (RQM) will be removed with ecu.test 2027.1.
As a replacement the user defined test management adapters can be used. These adapters offer significantly more flexibility and enable optimal adaptation to the respective workflow. A sample workflow is provided to assist with your own implementation.
HP Application Lifecycle Management (ALM)
The built-in HP Application Lifecycle Management (ALM) test management adapter will be removed in ecu.test 2027.1.
For continued interaction with HP Application Lifecycle Management (ALM) after that release, a user-defined test management adapter needs to be implemented using the ecu.test Test Management API.
PTC Integrity
The built-in PTC Integrity test management adapter will be removed in ecu.test 2027.1.
For continued interaction with PTC Integrity after that release, a user-defined test management adapter needs to be implemented using the ecu.test Test Management API.
Interactive test execution in ecu.test
The use cases for interactive test execution within ecu.test and the web application ecu.test drive largely overlap.
ecu.test drive is the significantly more flexible solution.
- More intuitive user guidance
- Better adaptability to the areas of application in the vehicle
- Usability with runner and remote through decoupling from ecu.test GUI
We will therefore focus on this solution in the future and will remove interactive test execution with ecu.test 2027.1.
MotionDesk
The dSPACE: MotionDesk connection will be removed in ecu.test 2026.3, as dSPACE no longer provides official support for it. Aurelion is available as a replacement.