ecu.test 2026.3 Release Notes
Release date: 29.09.2026
Overview
ecu.test 2026.3 takes aim at some of the most time-consuming tasks in everyday testing: repetitive test and project work, the effort of putting together multimedia test sequences, and version conflicts in shared workspaces. The ecu.test agent now provides end-to-end support for creating and adapting test cases and trace analyses, and also answers questions about how to use ecu.test – all right in the chat. Along the way, it learns from existing packages and takes customer-specific rules into account.
Four more highlights round out this release:
- Agentic multimedia test step: plans and executes complex multimedia test sequences from freely worded prompts.
- Develop locally, execute remotely: Test cases are created at your workstation and executed on the target test bench with just a few clicks.
- Workspace compatibility: run different ecu.test versions side by side on the same workspace.
- New Python library: makes it easier to build your own extensions in external IDEs like VS Code, PyCharm, and others.
ecu.test extras
- calibration: registers measurement variables across test cases and supports XAM measurement lists.
- drive: now also displays selection lists, input dialogs, and remaining wait times.
- lab: direct access to signals and parameters, plus error display right on the widget.
- trace.xplorer: revised graph view, image export (BMP/JPG/PNG)
Everyday performance
- EasyInsert: better overview and sorting for library workspaces
- Selective project execution: now available for every execution type
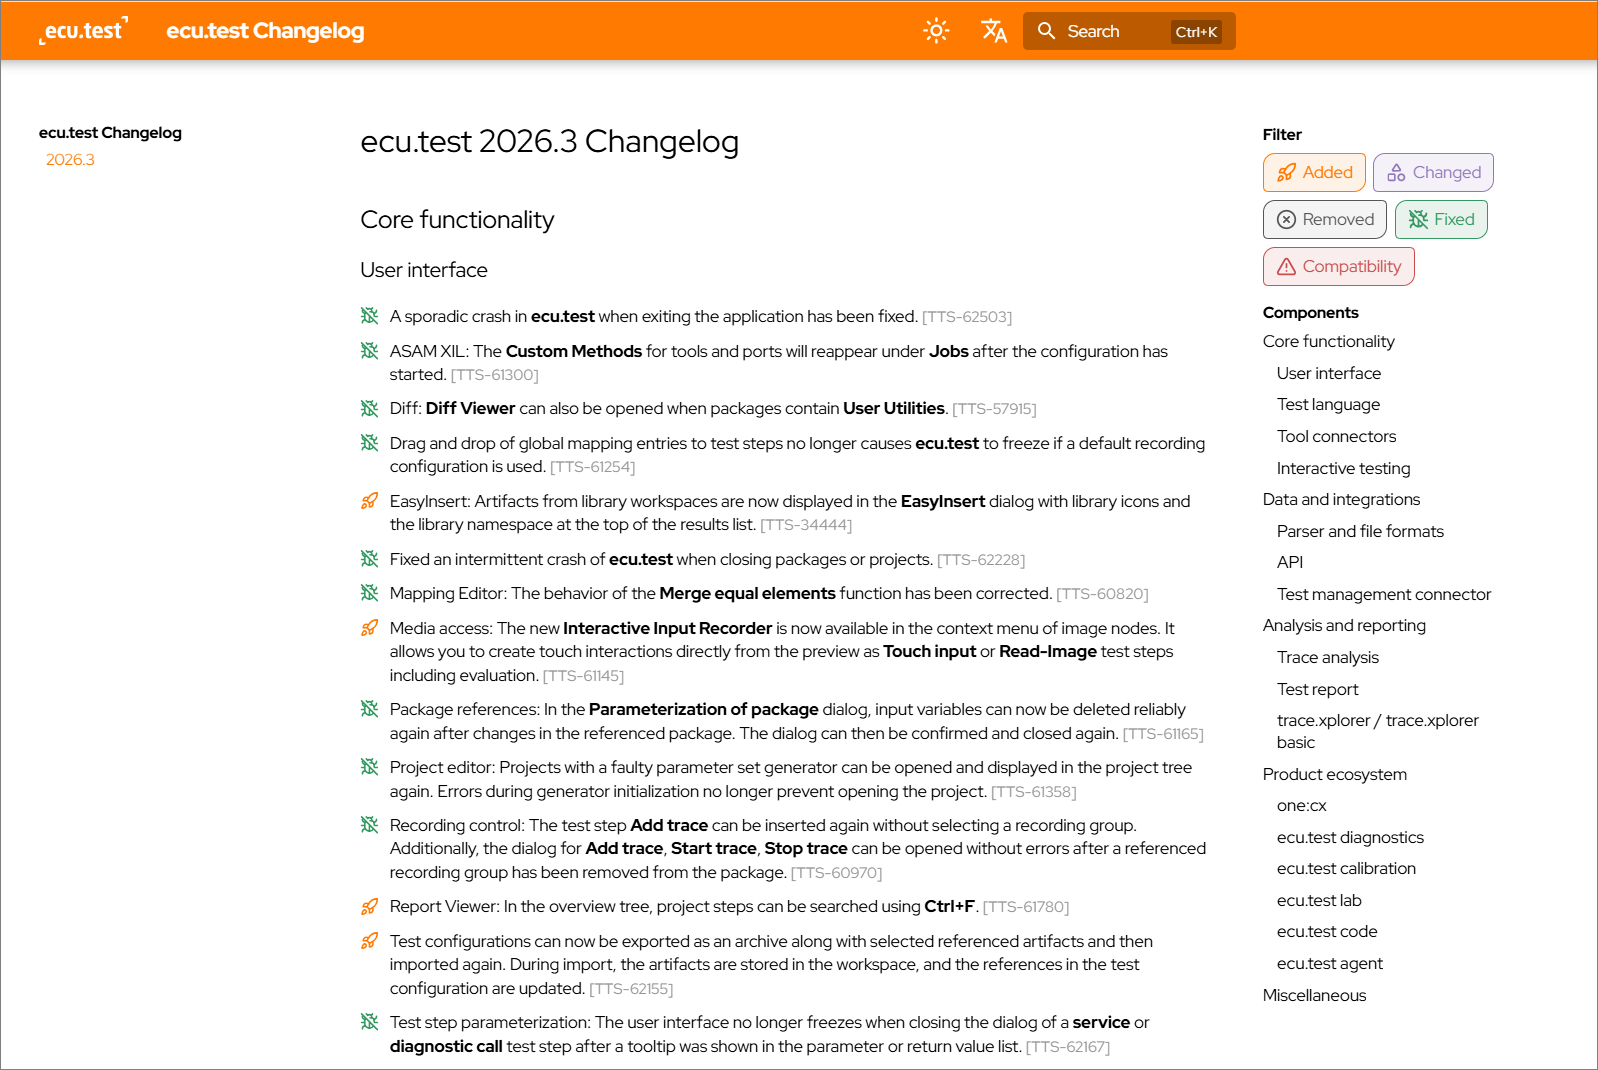
- New changelog format: modern, searchable, and filterable
There's more to come, too — including updates to communication, MiL, and test management. Details follow on the next pages. Enjoy the read!
Highlights
ecu.test agent chat
When creating test steps, a lot of contextual knowledge sits implicitly within the project and has to be taken into account manually for every single step. This takes time, creates inconsistencies, and is prone to errors. With the ecu.test agent chat, AI support comes directly into ecu.test and addresses exactly that. It handles repetitive work when creating test steps, delivers consistent results, and answers questions about ecu.test. That frees up more time for what really matters: the actual test logic.
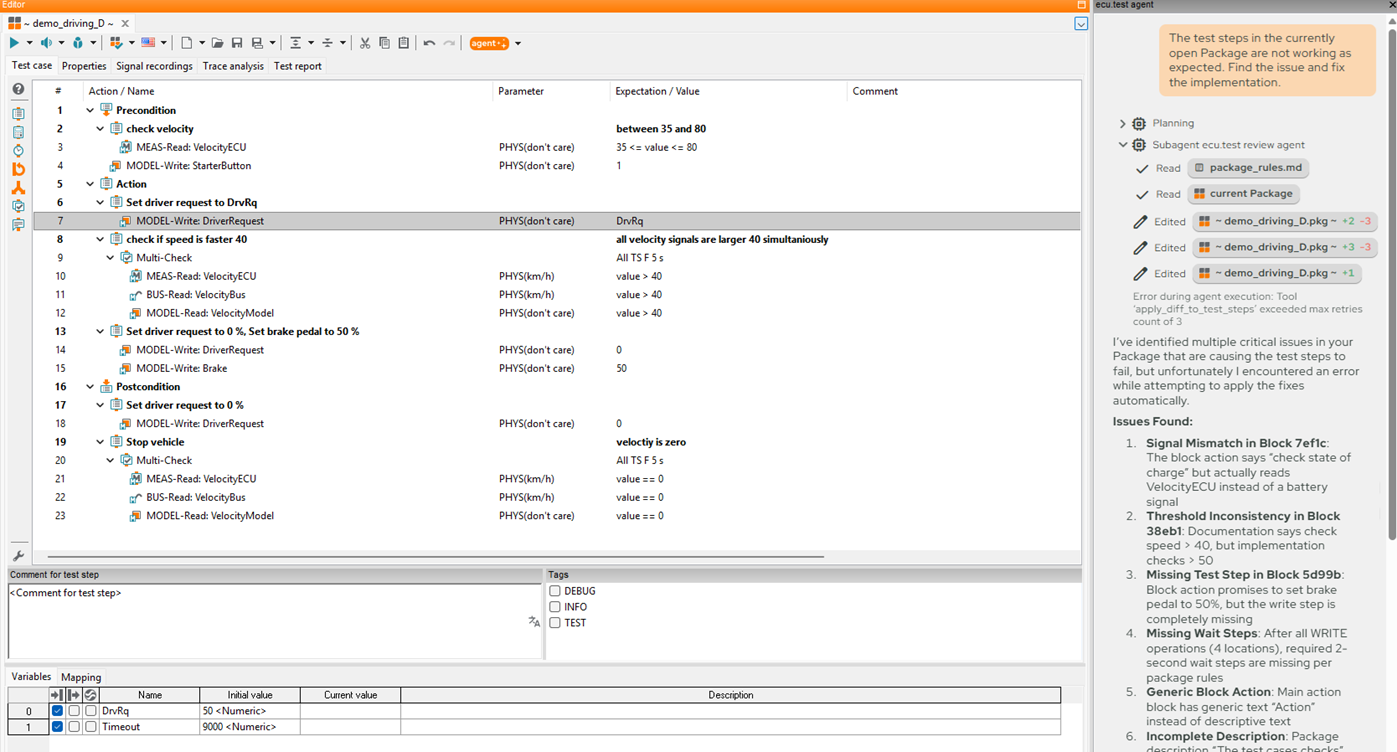
AI-powered test step generation
The agent assists in creating test case steps and generating trace analysis steps. In both cases, it automatically analyzes the existing project context, taking into account:
- Signal mappings, tool and port jobs, and package mappings
- Package variables and global constants
- The block description as the basis for suitable test steps
Because the agent works directly with the entire project setup, the generated steps fit your existing test environment and are usually ready to use right away. This significantly reduces manual errors when selecting signals, mappings, or package calls.
Note Trace analysis support is currently under active development and is available as a beta feature. The feature set will be continuously expanded in future versions.
Consistency through reference implementations
The agent learns from similar blocks in existing packages. Proven test patterns from your own project are incorporated into the generation process and applied to new test cases. This results in consistent and standardized recurring solutions without requiring active intervention from teams.
Customizable generation
Generation can be flexibly adapted to project-specific requirements:
- Configurable filters control how many elements from each category are included
- Custom instructions allow for adaptation to project-specific naming conventions, style guidelines, and individual preferences
ecu.test help right in the chat
Not sure how a specific feature works or how to solve a problem? Just ask in the chat - the agent will help you without ever having to leave your environment.
Agentic Multimedia test step
With the new Agentic Multimedia test step, complex multimedia test sequences can be planned, executed, and evaluated autonomously based on a freely worded prompt.
The test step works with all multimedia tools available in ecu.test, as well as with custom user tools. The model used for multimedia processing is selected centrally in the workspace settings, under the Multimedia settings. At runtime, the test step analyzes the prompt, derives suitable action sequences from it, and executes them on the linked multimedia tool (see example).
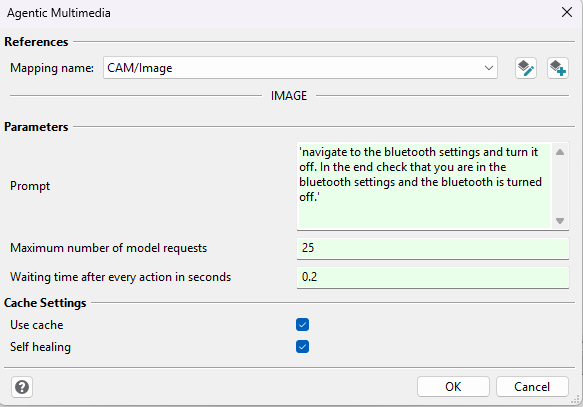
Optionally, previously determined prompt analyses, execution steps, and context information can be reused via a cache. This allows repeated executions to run faster and reduces unnecessary model requests. The test step parameters let you control
- whether the cache is used,
- the maximum number of model requests allowed, and
- how long to wait after each action.
With self-healing enabled, faulty cache entries can be discarded as needed, and the sequence can be re-executed without reuse.
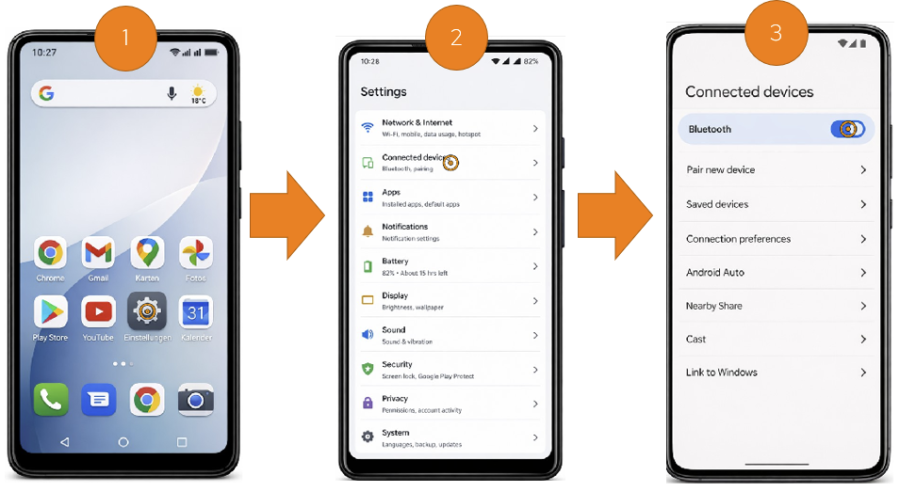
Example:The test step contains the following prompt: "navigate to the bluetooth settings and turn it off. In the end, check that you are in the bluetooth settings and that bluetooth is turned off." The current screen content of the connected system under test (SUT) is captured and analyzed. The agent determines the next action and executes it step by step, until the goal is reached.
In this case, it navigates fully autonomously to the Settings menu (step 1), switches to the Connected Devices menu (step 2), and disables Bluetooth (step 3) — without any hard-coded coordinates or manual test steps. In the test report, each intermediate step is documented with the model's reasoning and a screenshot of the SUT.
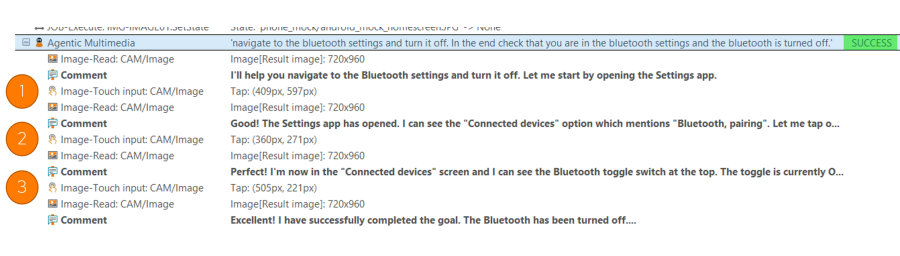
At the end, the test step evaluates the result as SUCCESS or FAILED and outputs a summary that includes the result and the model's reasoning.
Develop test cases locally, execute remotely via one:cx/test.guide
Test benches are a rare resource, and they deliver the most value when they're running tests almost continuously. Manually developing and adjusting new test cases, however, often ties up these resources and reduces overall utilization as a result. With the Schedule via test.guide feature, development and execution become one seamless workflow.
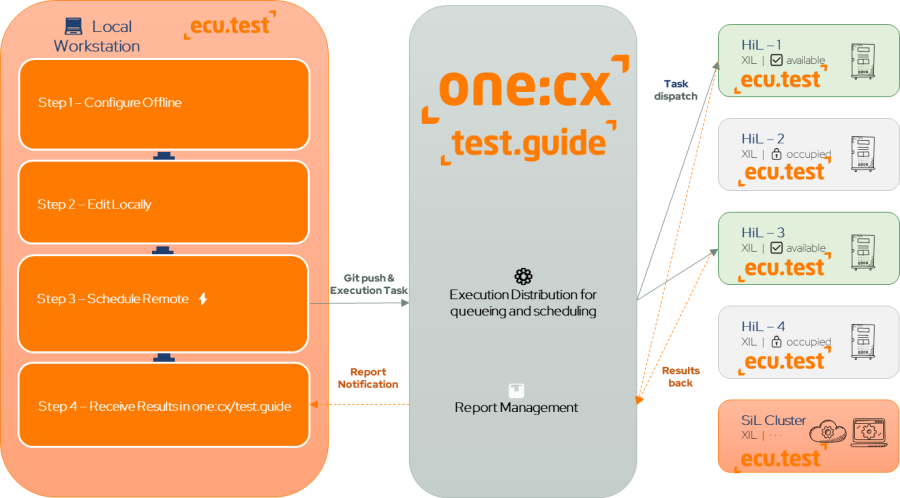
- Develop locally, execute remotely: Test cases are created at your workstation and executed on the target test bench with just a few clicks.
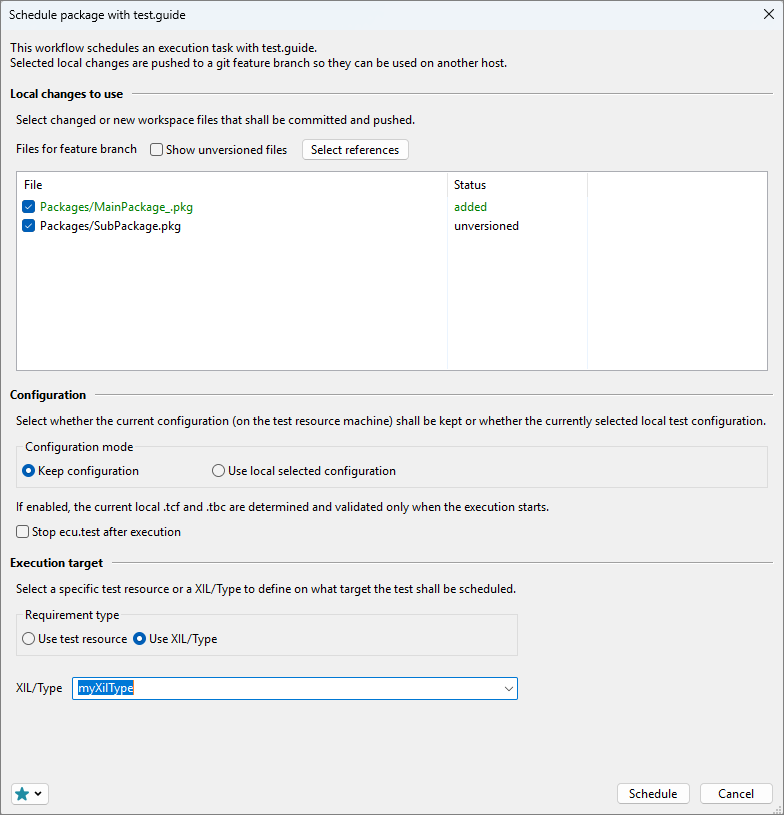
- Smart selection: In the execution dialog, you select the package changes, target configuration, and the right target system.
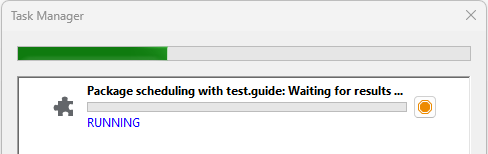
- Automated queuing: Changes are automatically pushed via Git, and the test is added to the test bench queue.
- Maximum utilization: The test bench stays free during development and is used exclusively for actual test execution – perfect for parallel use and CI automation.
Workspace compatibility across different ecu.test versions
Starting with ecu.test 2026.3, running different ecu.test versions side by side on the same workspace works significantly more smoothly.
This is especially helpful in environments where multiple teams share a common workspace — library workspaces, for example — and previously had to roll out updates simultaneously and across the entire organization. In the workspace settings, you can now specify an ecu.test version that the artifacts in the workspace should remain compatible with. When you save, ecu.test checks the artifacts against this target version, preventing them from accidentally becoming incompatible with older versions.
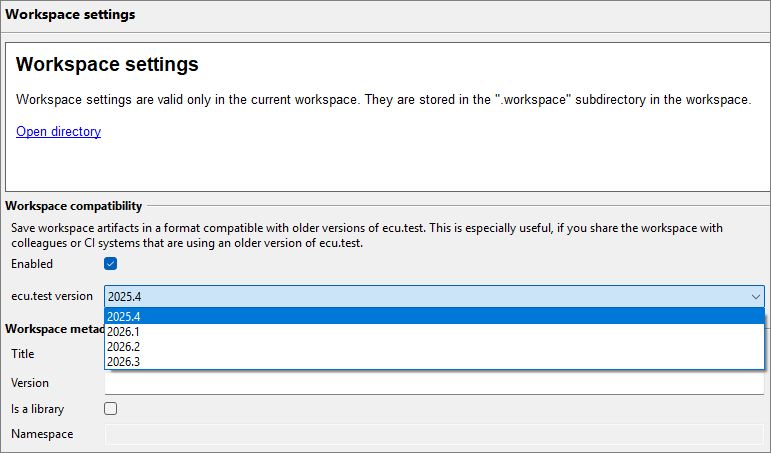
If an incompatibility can't be avoided, a dialog will let you know.
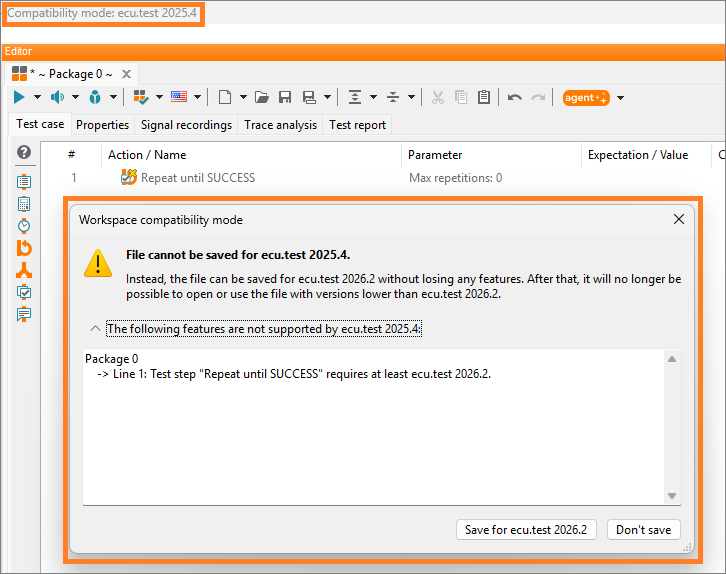
In addition, the Workspace Explorer now directly shows which ecu.test version an artifact or library is compatible with.
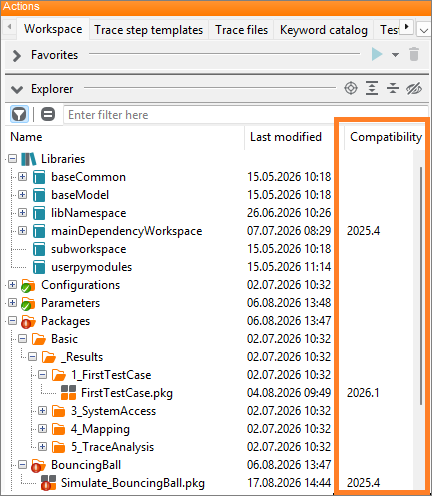
Additional enhancements:
- A new migration assistant (see Help → Migration Assistant) updates an entire workspace to a new ecu.test version through a wizard, instead of requiring you to open and save each artifact individually.
- The Object API has been extended accordingly, so that saving packages via the API also takes the compatibility setting into account — making the feature fully usable in automated workflows.
- Comprehensive user documentation covers setup, recommended workflows for version upgrades, working with shared workspaces, and known limitations.
ecu.test Interface Python Library
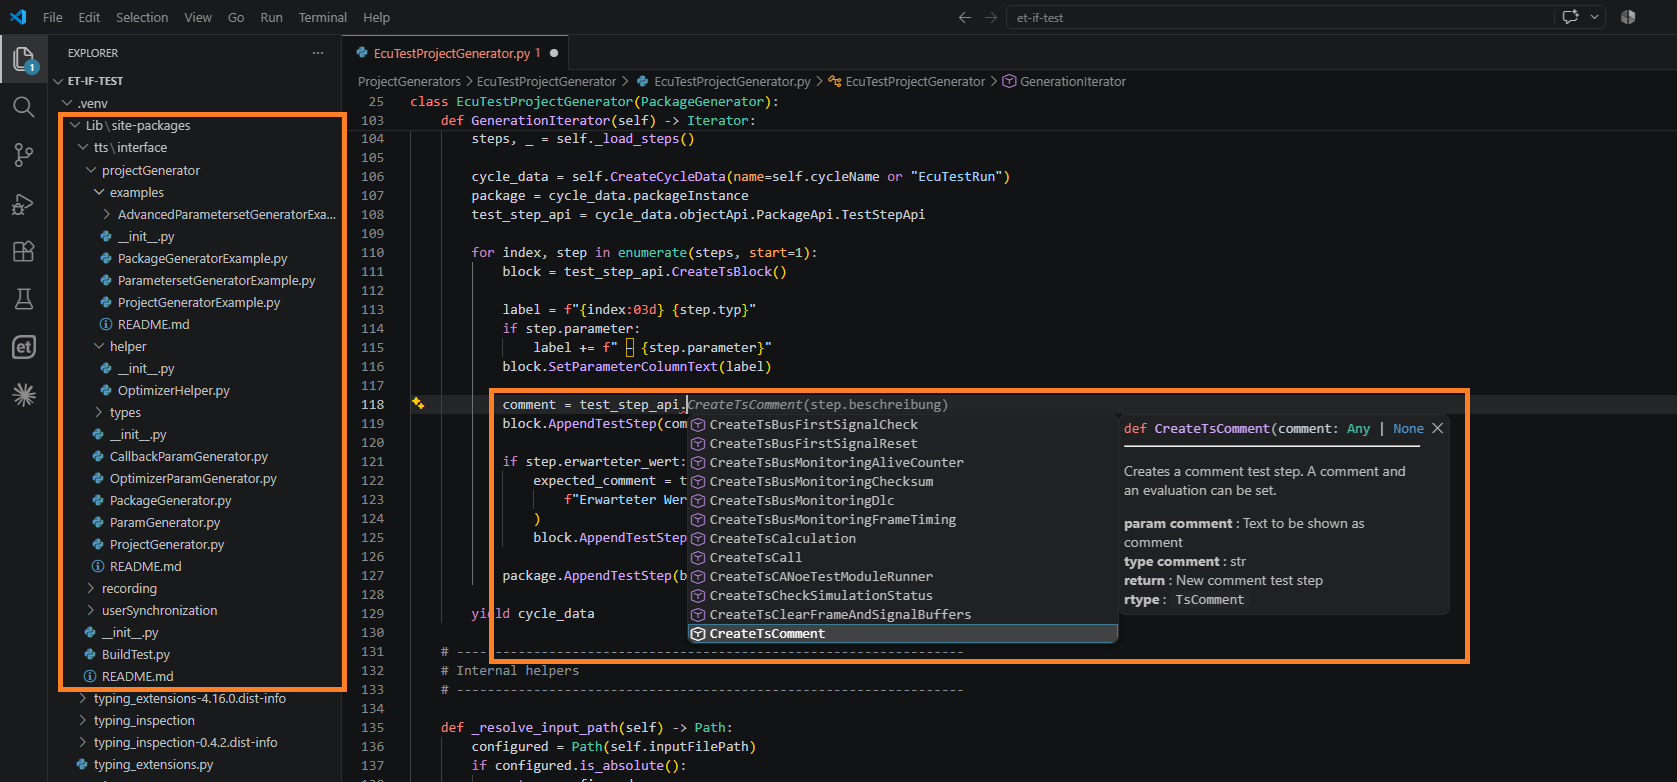
The new ecu.test Interface Python Library provides the public Python interfaces for developing custom ecu.test extensions. This makes it significantly easier to develop these extensions in an external IDE such as VS Code or PyCharm.
The library is distributed as a Python wheel and includes both API documentation and usage examples. This allows modern IDEs to offer autocomplete, including inline help. It also enables AI coding assistants like GitHub Copilot or Claude Code to provide better support when creating, modifying, or validating ecu.test extensions. Usage is described in detail in the ecu.test Help and currently covers the following API components:
ecu.test extras
ecu.test calibration
XAM measurement lists and registration of measurement quantities
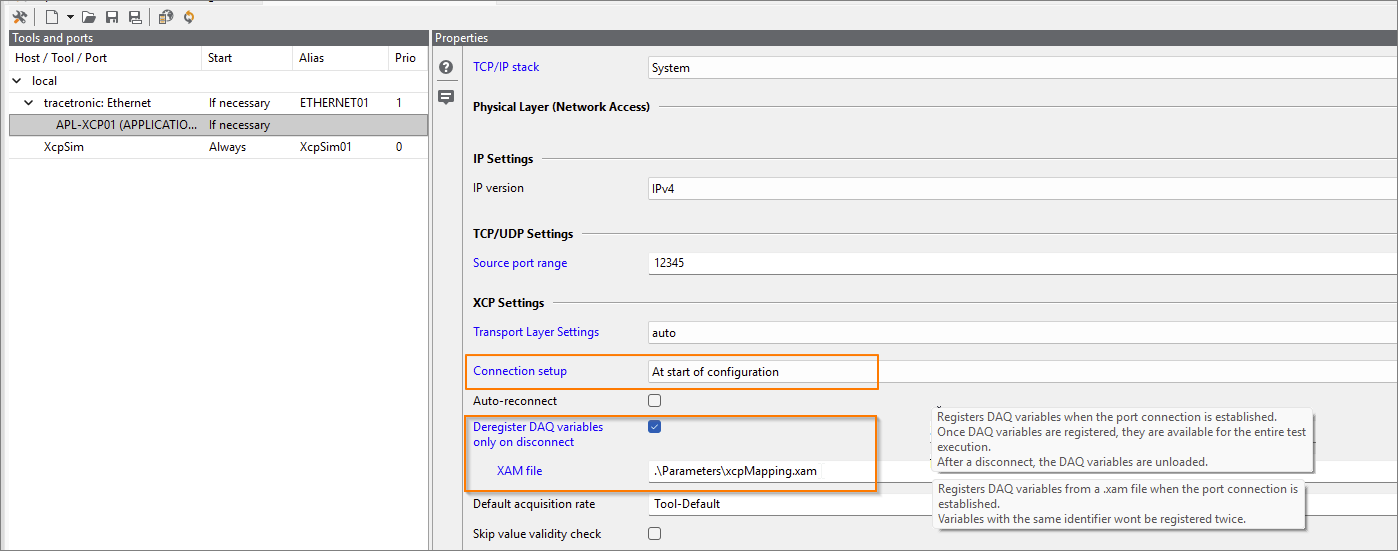
Registering a large number of measured quantities can sometimes take quite a while. If the same measured quantities are used across several consecutive test cases, they can now remain registered after the test case ends — eliminating the need to re-register them at the start of the next test case.
This approach is especially useful when "At start of configuration" is selected forConnection setup. It significantly reduces preparation time during test case execution.
To make managing large measurement lists easier, the measurement list used for recording can now be defined as a global mapping file (XAM). This file can, for example, be generated from an A2L file via the Object API.
ecu.test drive
Support for additional test steps
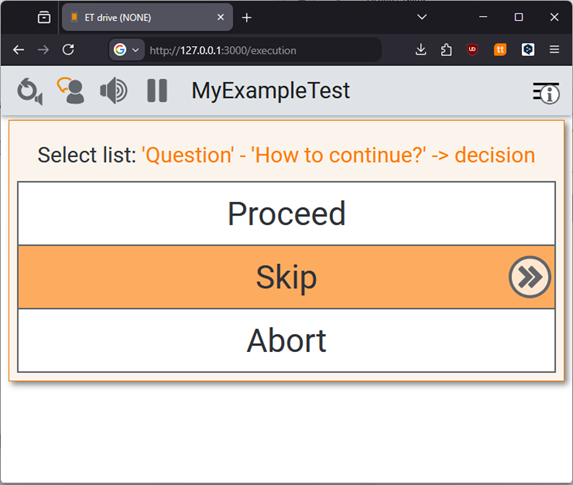
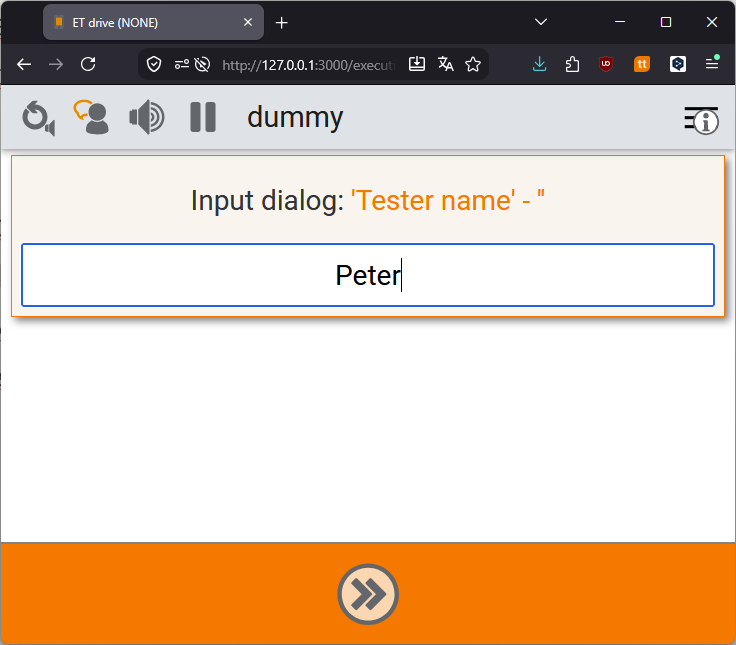
ecu.test drive now also visualizes the following test steps:
- Selection list: choosing one of several predefined options
- Input dialog: single-line text entry
- Wait: shows the remaining wait time
When configured with a wait and time option, it also supports:
- Job Call
- Read Variable Reference
- Package Call
- Execute Service
 |
 |
|---|---|
Minor UI and workflow improvements
- The test case name is now also displayed in the title bar during test execution.
- Reading out the "Action" and "Expectation" prefixes can now be configured in drive.
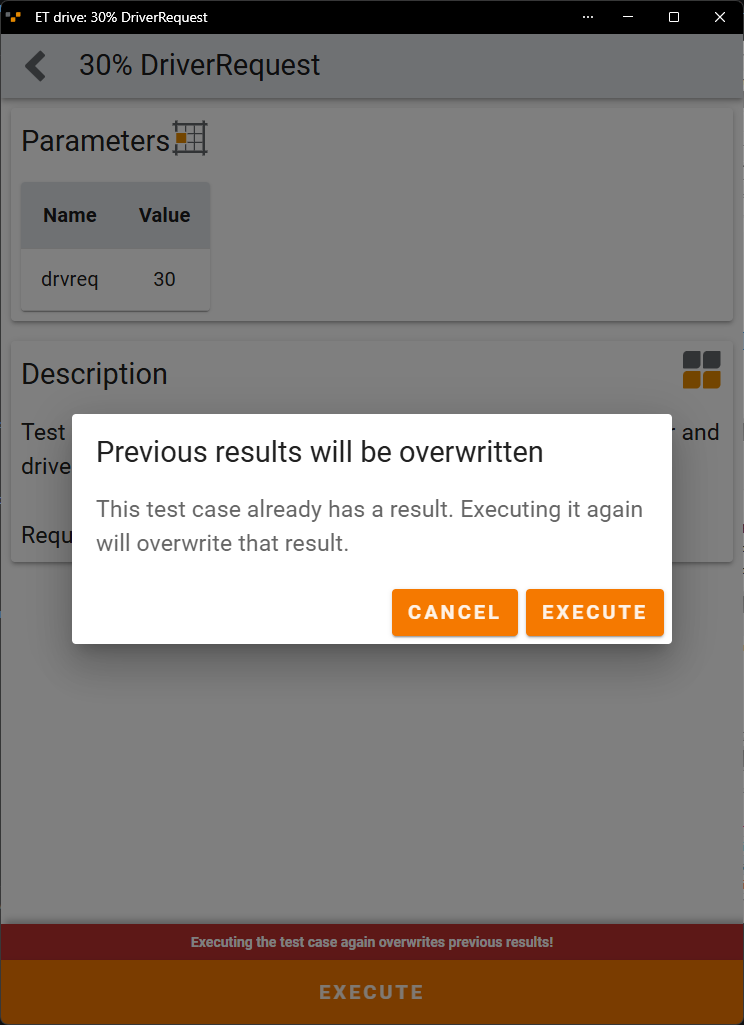
- To prevent a project component from being unintentionally executed again, the default selection shown when opening an already started project has been adjusted. A warning message and a confirmation prompt have also been added.
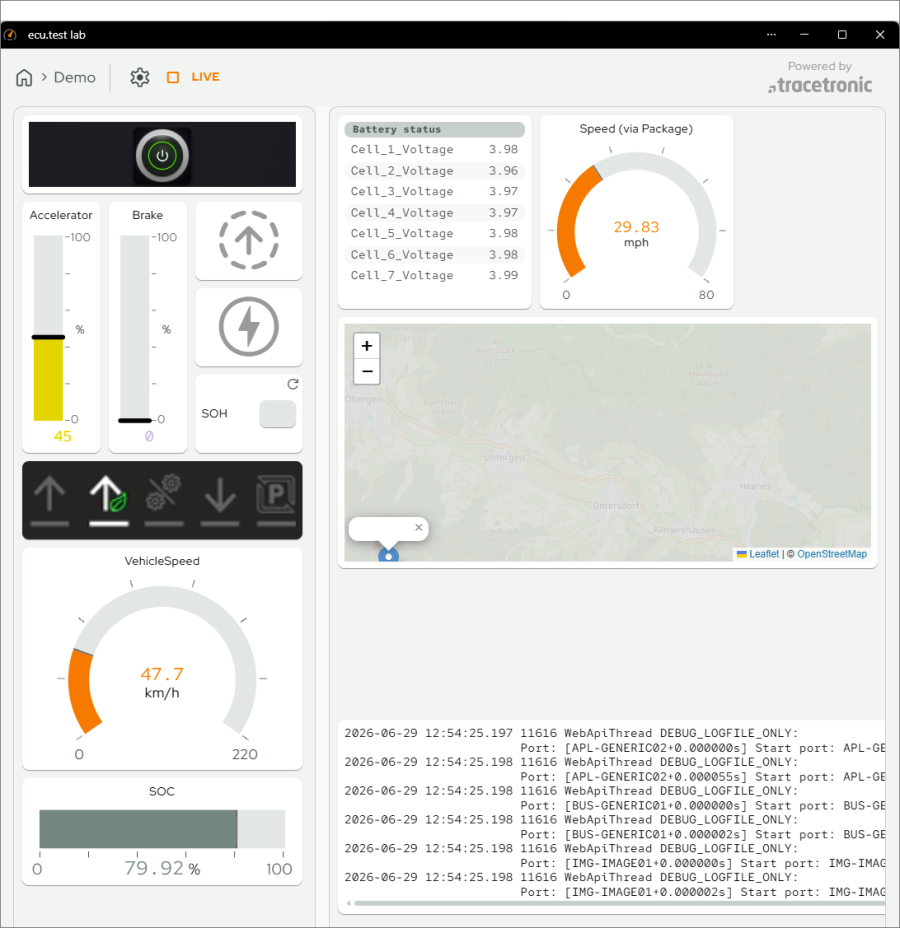
ecu.test lab
Multi-selection of widgets
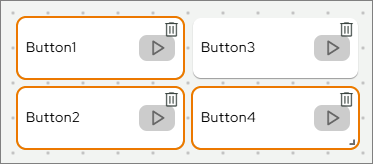
Holding down the CTRL key now lets you select multiple widgets at once, so you can copy, cut, or delete them together.
Displaying two pages side by side
It is now possible to display two pages side by side with a freely adjustable ratio. Combined with the ability to insert direct page references, this offers significantly more design options and avoids having to create duplicate pages.
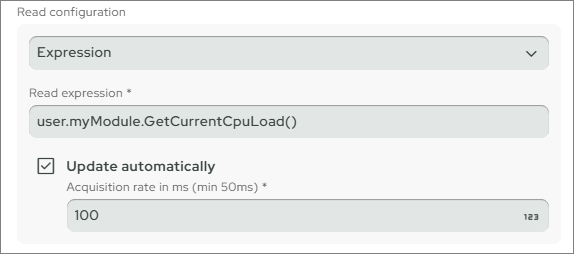
Expressions with sampling rate now available in almost all widgets
The Expression access type is now available in significantly more widgets and can also be configured with cyclic updates.
Direct access to signals and parameters
Previously, signals and parameters from the test environment could only be accessed through pre-defined mappings or packages. Starting now, it's possible to directly access values from the bus, model, measurement, and calibration.
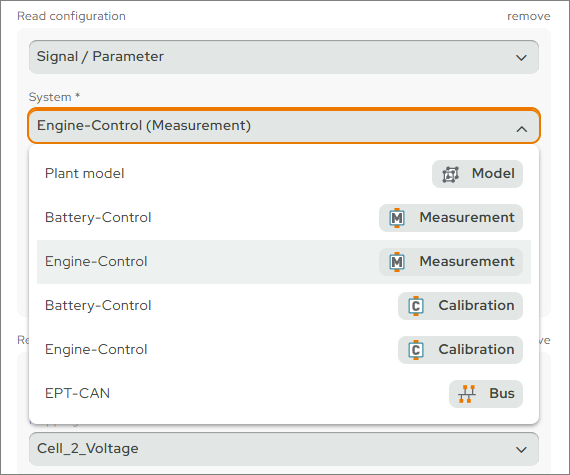
Note Access restrictions apply. Direct access must first be enabled in ecu.test.
Error messages directly on the widget
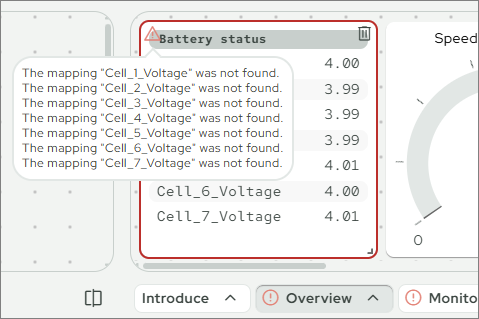
Previously, error messages were displayed collectively as notifications at the top of the window. This made it impossible to associate an error with a specific widget and made troubleshooting more difficult. Starting now, configuration errors are displayed directly on the affected widget while the configuration is running. This simplifies troubleshooting and provides a quick overview of the extent of the errors.
Runtime errors in LIVE mode are also reported on the widget and now interrupt the cyclic polling of values. To resume cyclic polling, simply click the error indicator.
trace.xplorer
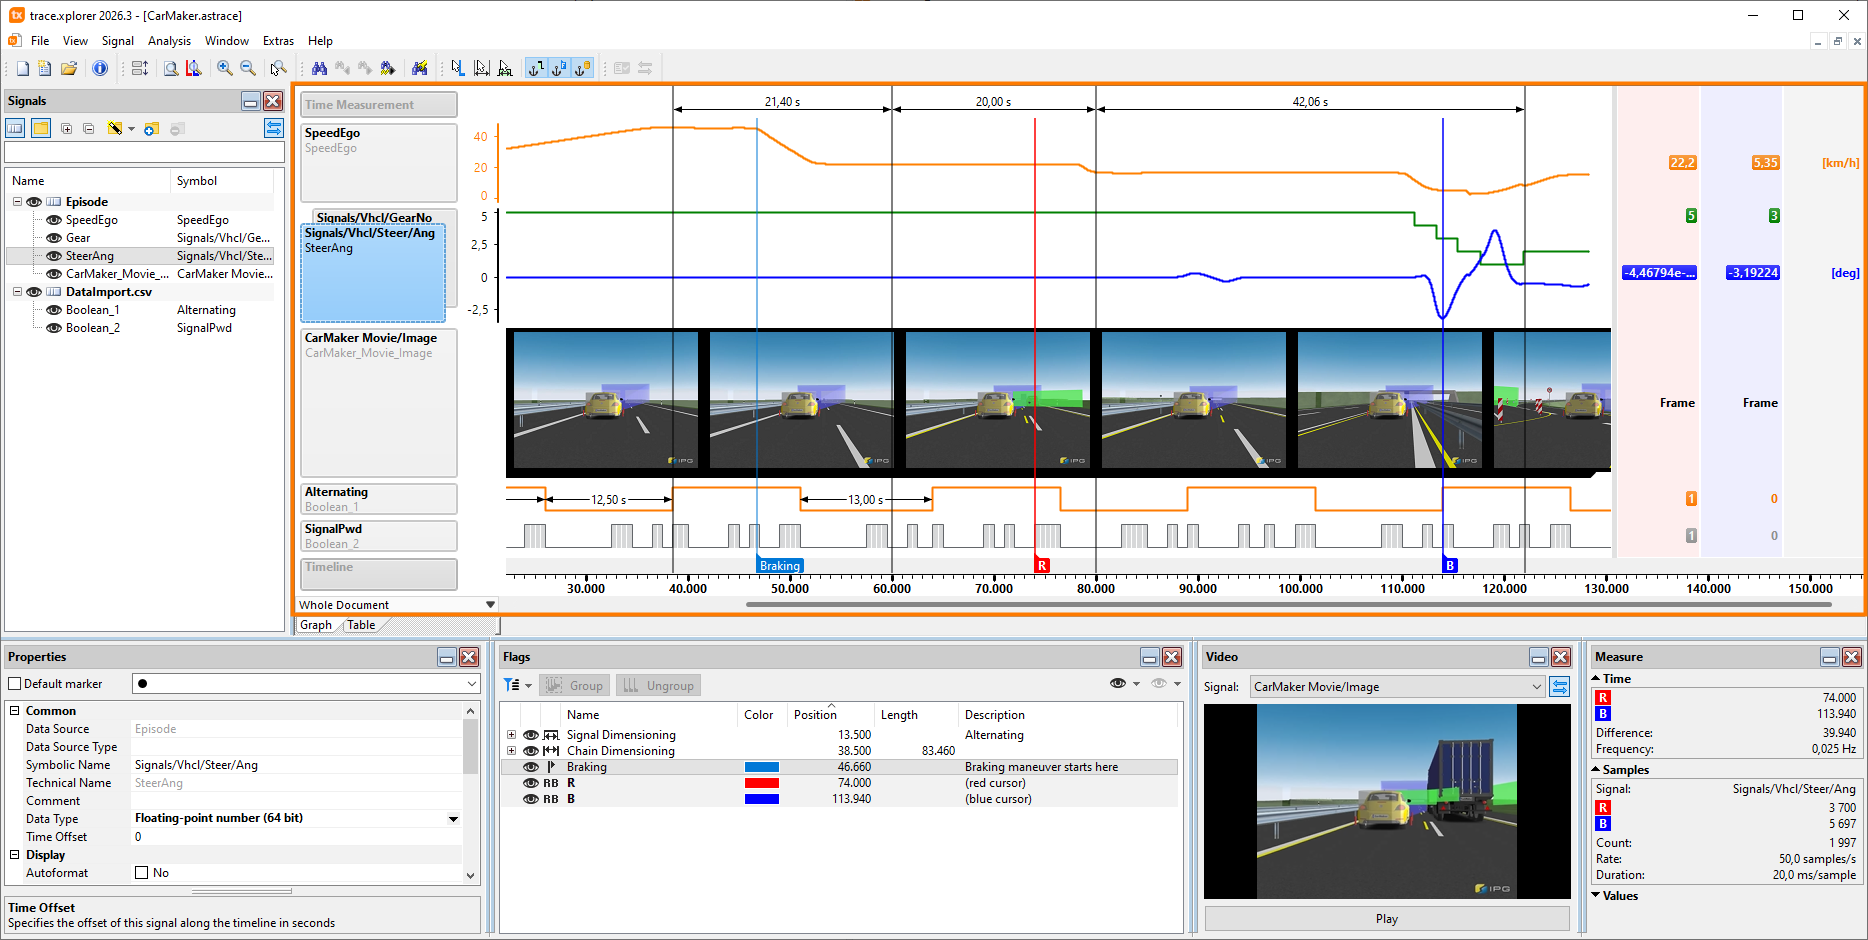
Graph view completely redesigned
The implementation of the graph view has been completely revised. The changes are mostly internal. Beyond minor visual improvements, performance gains are already noticeable when displaying large traces.
Changing the formatting, time offset, or display height of individual signals no longer requires redrawing the entire view. The same applies to rearranging signals via drag-and-drop. The result is a noticeably smoother and more responsive experience. The table view is not affected by these changes.
Creating images from the graph view
For documenting or presenting test results, it may be necessary to generate specific signal waveforms as images. A simple screenshot of the application window, however, isn't enough once the captured time range or the number of signals becomes too large.
To address this, the new File > Create Image ... function is now available. This function can write an image of the active graph view either to the clipboard or to an image file (BMP, JPG, or PNG). All visible signals are displayed exactly as they appear in the graph view in terms of their arrangement (height, order, stacks) and formatting. Flags and dimensionings can be disabled if needed. The time range to be exported can be set individually, and the maximum size of the created image can be limited. A preview window allows you to check the image before exporting it.
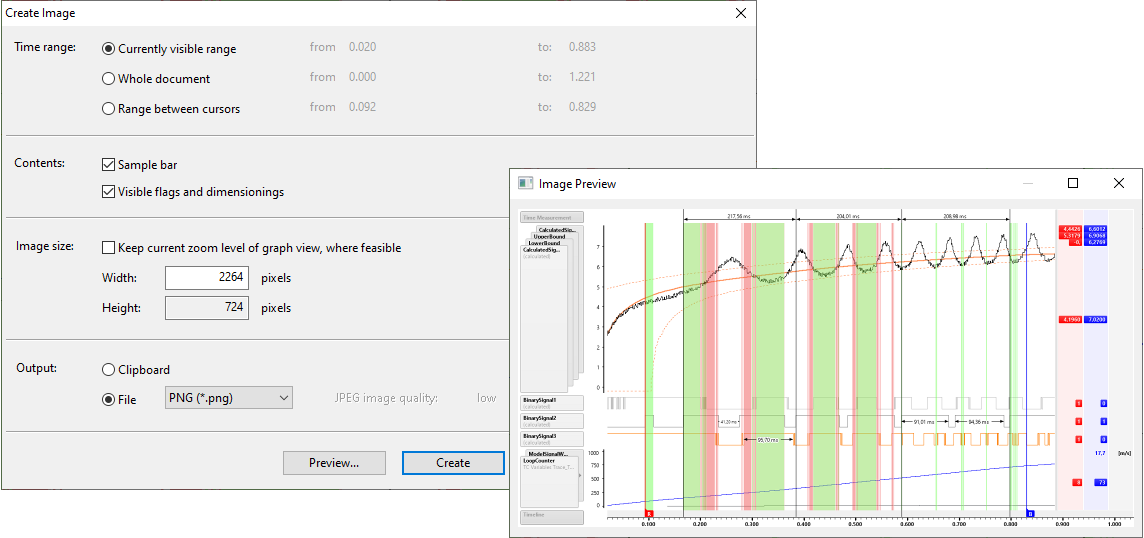
Note A trace.xplorer license is required to use this feature.
Managing application settings more easily
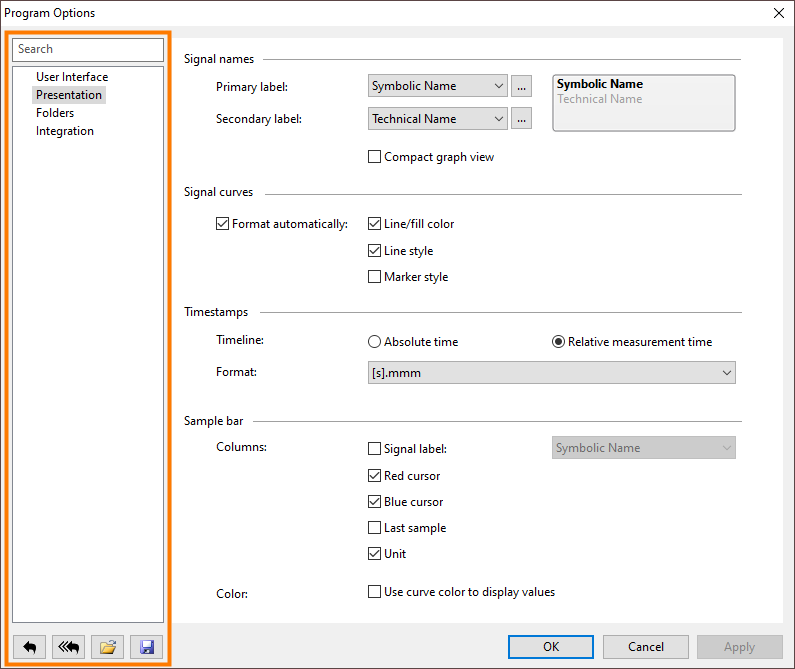
The dialog for editing application settings has been updated. A search function allows you to quickly find specific options on the settings pages, which are now displayed in list form.
New buttons below the list let you reset the current settings page or all pages to their default values. In addition, settings can now be exported to a file or imported again, making it easy to back them up or transfer them to other user profiles without effort.
The dialog can be accessed via the File > Program Options ... menu.
Usability
EasyInsert: Support for library workspaces
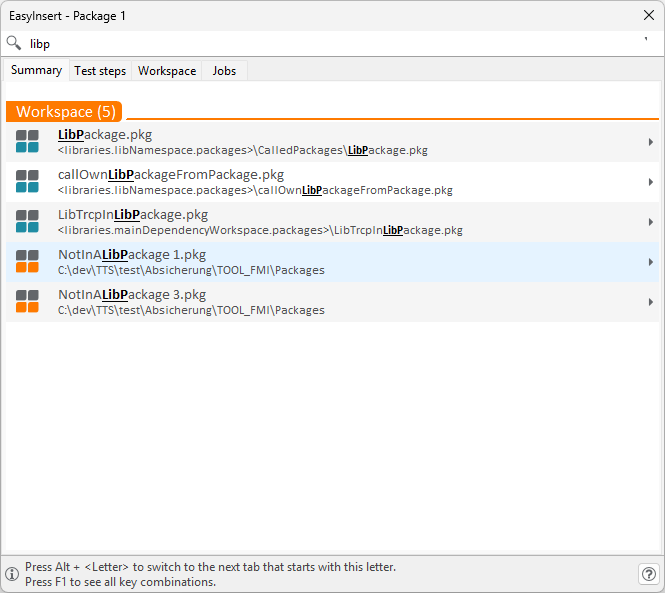
Artifacts contained in libraries, such as packages, projects, and analysis packages, are now displayed in EasyInsert with the same teal-colored icon used in the Workspace Explorer.
The library's namespace appears in angle brackets alongside the artifact's relative path. Library elements are sorted to the top as the best matches.
This makes inserting library content in the editor significantly faster and clearer.
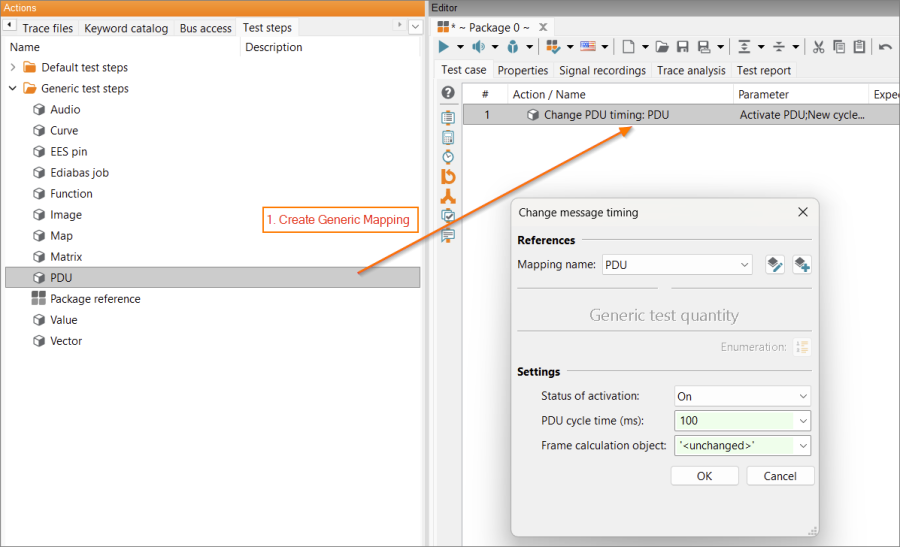
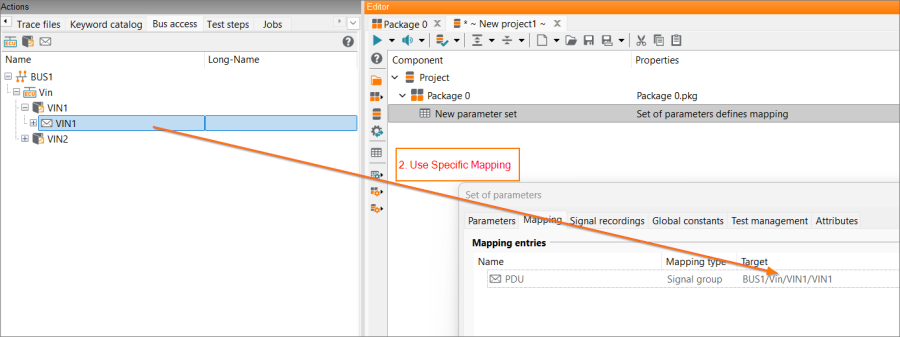
Generic PDU test step
The new generic test step Change PDU Timing makes it possible to describe generic test cases involving PDUs that are to be sent cyclically. The specific PDU assignment is made when parameterizing the mapping in the test case, for example in conjunction with the mapping parameterization in the project.
Selective project execution
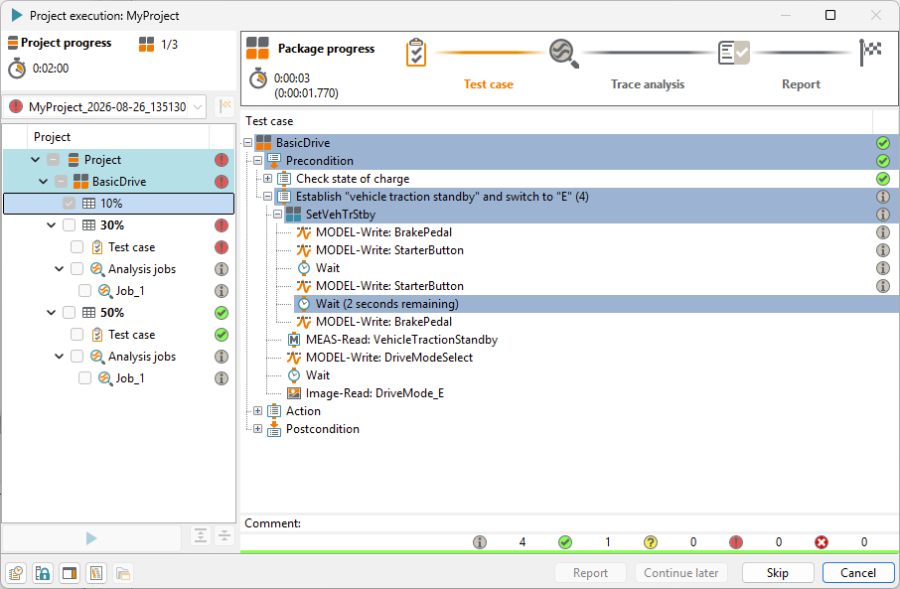
Selective project execution was previously limited to interactive testing. We're now making this execution mode available for every form of project execution. In the execution dialog, you can select which components of the project should be executed, regardless of their predefined order.
After executing one or more components, execution can be paused for any length of time and later resumed with additional components or ones that have already been executed. Finally, the execution is marked as complete, ending the run. This can happen regardless of whether the project was executed fully or only partially.
Note Selective project execution currently only supports package calls, folders, and parameter sets.
New changelog format
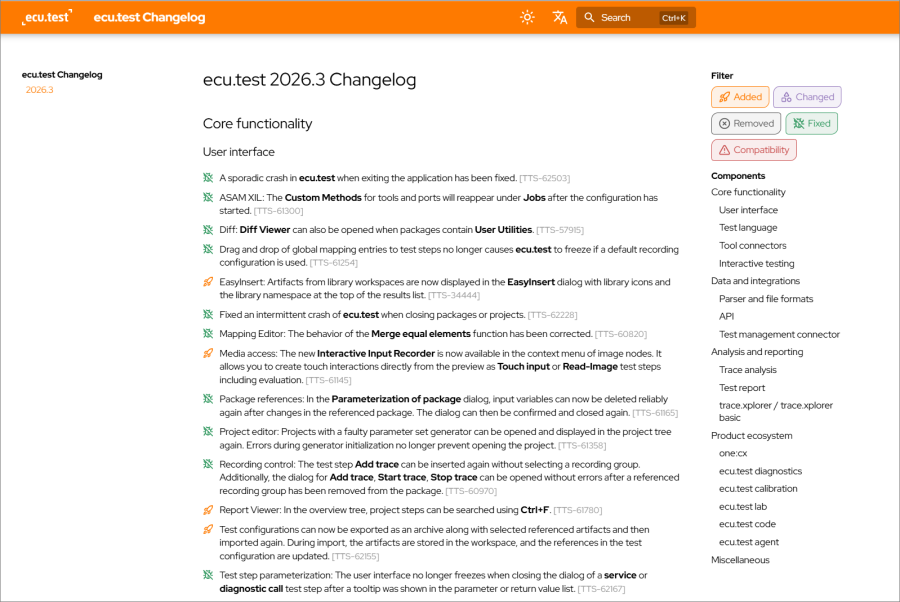
Changelogs – available both in the installation directory and online – are now provided in a format that matches the ecu.test user documentation.
Along with a modernized layout, the new format also allows you to search and filter for specific entries.
Test aspects
Communication
Ethernet logging now lossless even at gigabit range
SOME/IP and socket adaptor communication, including MACsec-protected data, can now be processed live in ecu.test from the ASAM CMP, PLP, and TECMP Ethernet logger data streams. The optimization for DLT was already introduced in ecu.test 2026.2.
In this release, processing performance has been significantly increased for all other supported protocols. As a result, ecu.test can now record traces and read signals without loss even at data rates in the gigabit range.
Note This improvement is active automatically and applies to all Ethernet bus capture protocols — no manual activation is required.
IEEE1722: IPv6 support
CAN bus and J1939 communication transmitted via Ethernet over IEEE1722 can now also use IPv6 as the network layer.
TLS support for TCP client
The TCP client port has been extended to support custom communication running on top of TCP that is secured with TLS 1.2 authentication and encryption. The send and receive jobs automatically encrypt and decrypt the transmission.
PTP support with the Ethernet tool for Windows and Linux
The following jobs are now also available for Linux on the Ethernet RAW port:
- StartPtpClient
- StartPtpMaster
They enable the simulation of a timing master or client, respectively. These functions were previously reserved for Ethernet support via the Vector XL tool.
MiL
Custom restructuring of model variables
Large models are now significantly easier to manage: model variables can be selectively filtered, renamed, and displayed in a custom structure. This turns complex technical models into a clear, project-specific view where relevant signals can be found and used more quickly.
This noticeably simplifies everyday work, especially when the functional view doesn't match the original model structure. All links to the actual model variables are preserved throughout, so access to the real model variables remains reliable at all times.
Multimedia
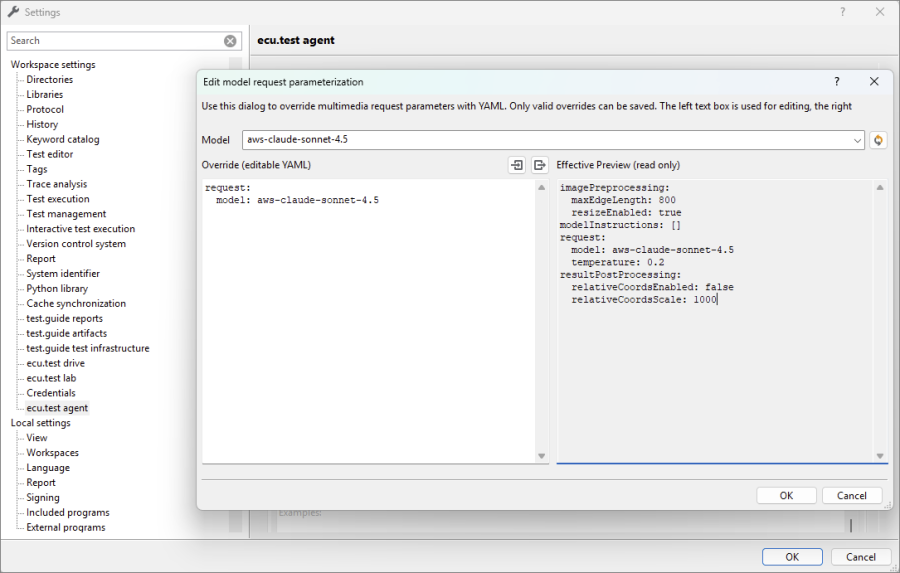
Central configuration of the multimedia agent
The multimedia agent can now be configured centrally in the workspace settings. Among other things, the following settings can be adjusted:
- model selection
- temperature
- image preprocessing options:
- resizing
- maximum edge length
- coordinate post-processing
- additional model instructions
Changes are validated immediately, and the resulting configuration can be reviewed before saving. This makes it easier to configure multimedia test steps consistently and traceably.
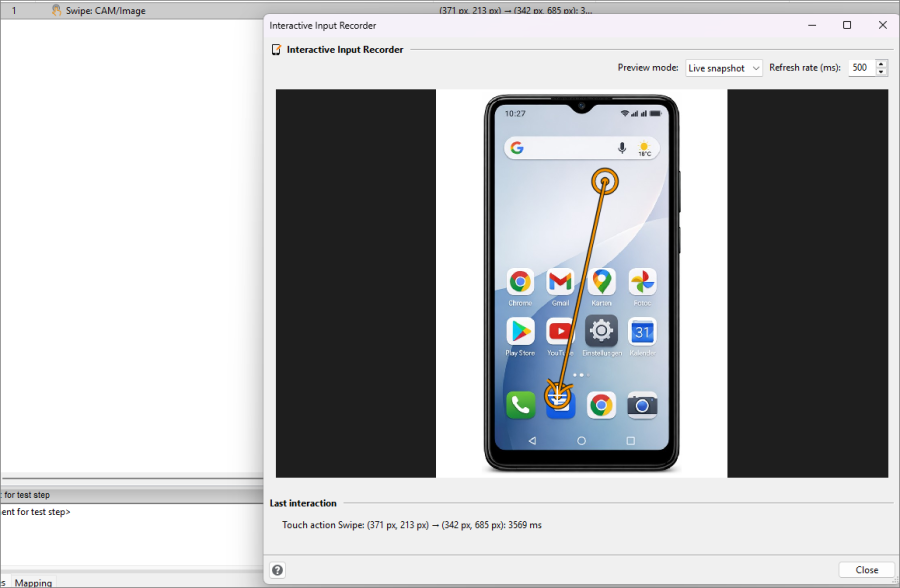
Interactive Input Recorder: Record & Replay
Manually creating TouchInput and ReadImage test steps used to be tedious, since coordinates had to be entered by hand as parameters in the test steps. With the new interactive Input Recorder, the system under test (SUT) — for example, an ADB device or a website — is streamed live and displayed in a window. Within this window, gestures such as Tap, Swipe, or Read can be performed directly. These actions are automatically added to the package as correctly parameterized test steps.
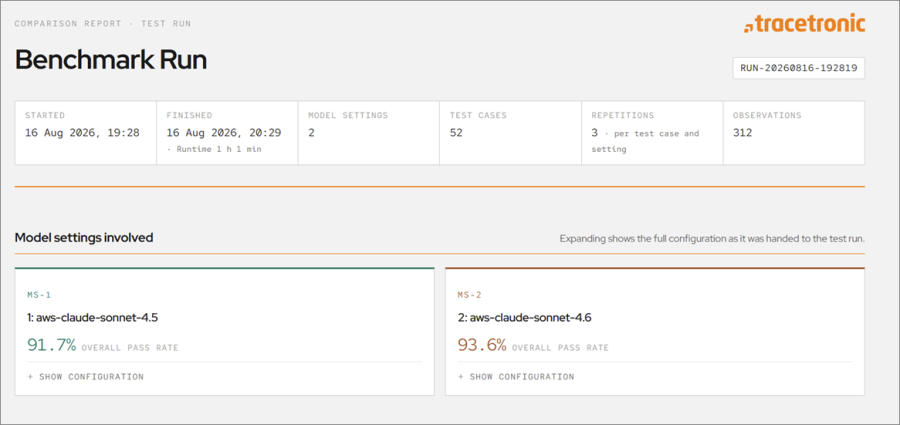
Benchmark for multimedia models
A benchmark workspace is now available for evaluating AI-powered test steps. ReadImage, Touch, and agentic test steps are automatically executed in a simulated test environment and evaluated using a score. This allows different models to be compared reproducibly and makes it possible to identify early on how changes to models, settings, or prompts affect results. The workspace can be requested via support@tracetronic.com.
Test management
Changes to the adapter for integrated test management
With ecu.test 2026.1, it was announced that the integrated test management adapters for HP QC, PTC Integrity, ETM, and Polarion will be removed starting with ecu.test 2027.1. Starting with ecu.test 2026.3, these adapters are only available via a feature flag — they are no longer visible by default but can still be used by enabling the flag. A Python-based solution is now available as the successor, offering greater flexibility and improved maintainability. Action required: If you currently use, or still need, any of these integrations, please contact support soon:
- to have the feature flag enabled for continued use
- to jointly work out a transition plan
Support for Siemens Polarion 2606
With the release of Siemens Polarion 2606, we've updated the example implementations as well as the tracetronic-polarion library to ensure full compatibility with the new version. This ensures continued functionality and enables you to take advantage of the new features in Polarion 2606.
Trace analysis
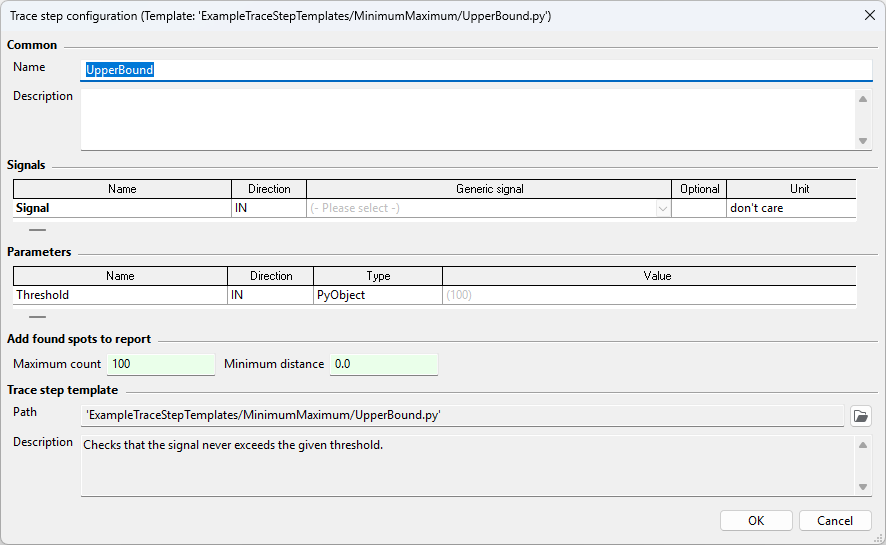
Trace Step Templates: Default values for parameters
Until now, defining default values was only possible for array-based NumPy trace step templates. With ecu.test 2026.3, this is now also possible for event- and flow-based Python trace step templates. To improve traceability, the default values are displayed when configuring template-based trace steps.
Further test aspects
Default recording configuration: naming template for recording groups
The default recording configuration makes it possible to manage recording groups centrally via the test configuration. In addition, the naming template is now also inherited from the matching recording group in the default recording configuration whenever no naming template is defined in the test package.
Report Viewer improvements
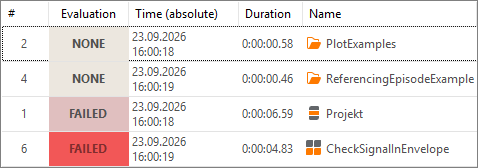
The view for project steps now includes a column for duration. Previously, this information was hidden in the details of each step; now it can be viewed at a glance for multiple steps.
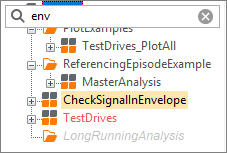
In addition, it is now possible to search for project steps by name in the overview tree. When the tree is selected, the search can be started by typing or by pressing Ctrl+F.
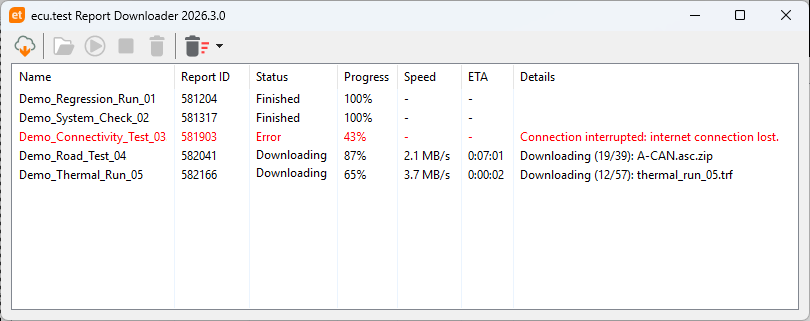
Report Downloader - Easily download an entire Report Directory from test.guide
A new application, report_downloader, is available in the installation directory. This application allows you to download reports from test.guide using their report IDs. The necessary connection settings are retrieved from the last workspace, but can be overridden if desired. Downloads can also be initiated via a script using the CLI.
New tools and versions
| Provider | Web site | System | Product name | Version | |
|---|---|---|---|---|---|
| 1 | dSPACE | Release link | Sensor-based realistic real-time simulation for ADAS/AD | AURELION | 26.2 |
| 2 | dSPACE | Release link | Software for developing ECUs | ModelDesk | R2025-B |
| 3 | Vector | Release link | Open-source library for connecting SIL environments | SIL Kit | until version 5.0.6 |
| 4 | npcap | Release link | Software library for Windows that lets programs intercept, monitor, and analyze network traffic | npcap | 1.88 |
APIs
Command Line Interface
Flag for fully automated use
The new startupAutomated flag ensures that, even when using the ecu.test GUI, all pop-ups that normally require user interaction are handled automatically. This simplifies fully automated workflows.
Installing Python dependencies via CLI
Previously, the Python libraries defined in a workspace could be installed either manually via the program settings or automatically at program startup. They can now also be installed via the command line:
- ecu.test task install-python-libraries --workspace \<path>
This command installs the libraries for the specified workspace without requiring ecu.test to be launched with its user interface. This is especially helpful, for example, when creating a Docker image with a fully prepared workspace.
Custom Checks
Results extended with ID and origin
Results from package and project checks now support the id and origin fields.
- id allows custom implementations to uniquely and consistently identify a finding type.
- origin is set by ecu.test and indicates the namespace of the workspace the check originates from, or the value "internal" for internal checks.
Applying fixes via API
When checking packages via the Internal API or REST API, a new optional parameter controls whether unambiguous fixes are applied. The response structure also includes information about which issues were resolved by fixes.
Object API
Extension of the API for pkgattr.spec and prjattr.spec
Previously, package and project attribute specifications could only be adjusted by manually editing the files. However, custom test management adapters require the ability to automatically derive and modify attributes from the ALM. The new AttributeSpecApi Object API enables programmatic reading, modifying, and saving of attributes. This allows for dynamic synchronization with the ALM, reduces manual effort, and increases the consistency of test data.
REST API
Querying general ecu.test information
The new info endpoint lets you query general ecu.test information, such as relevant directories and language settings. This enables more complex processes to be implemented as part of fully automated workflows.
Test Management API
Changes
As part of the new interface library, the Test Management API has been migrated to a new interface. This benefits both IDE integration and AI-assisted development alike — through improved code completion, clearer conventions, and better discoverability of available functions. Backward compatibility is fully maintained. The previous interface continues to be supported, so existing implementations keep working without any changes.
Discontinuations
Discontinued features and incompatibilities in this version
Fibex support
Fibex support for bus is being deprecated and has been removed. Fibex support for DLT will remain available.
Basler: Pylon
Basler cameras are compatible with the GenICam standard, which eliminates the need for a separate tool connection. For this reason, the Basler: Pylon tool has been removed. When using a Basler camera, the GenICam tool connection can be used as an alternative.
Bus monitoring test steps
The bus monitoring test steps used to check timings and DLC can be implemented much more effectively with trace analysis and the provided analysis modules. Starting with ecu.test 2026.3, support for inserting new test steps will be discontinued. Support for execution will be removed in ecu.test 2027.1 at the earliest.
Import in connection with CustomChecks
Custom tests may use a module that has been moved. Therefore, check the imports and adjust them if necessary. The discontinuation will take effect with ecu.test 2026.3.
- old: tts.core.common.check.Constants
- new: tts.interface.customCheck.Constants
Real-time package references
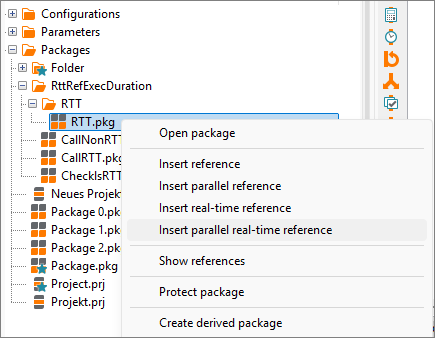
dSPACE has changed its interface for controlling the real-time environment with ControlDesk 2024-B. Since this dSPACE release, it is no longer possible to execute real-time package references with ecu.test.
Attention The discontinuation only applies to real-time package references. Other features related to real-time testing (RTT) are not affected.
dSPACE MotionDesk
The dSPACE: MotionDesk connection has been removed, as dSPACE no longer provides official support for it. dSPACE AURELION is available as a replacement.
TRF files can no longer be generated for project reports
With the introduction of the PRF format for project reports, the TRF format has become obsolete. Although the TRF format could be activated via the workspace settings during the migration phase, this fallback setting has been removed. Until then, based on feedback received, work is underway to improve some workflows with and without test.guide.
Log directories/package subfolders now prefixed with line number
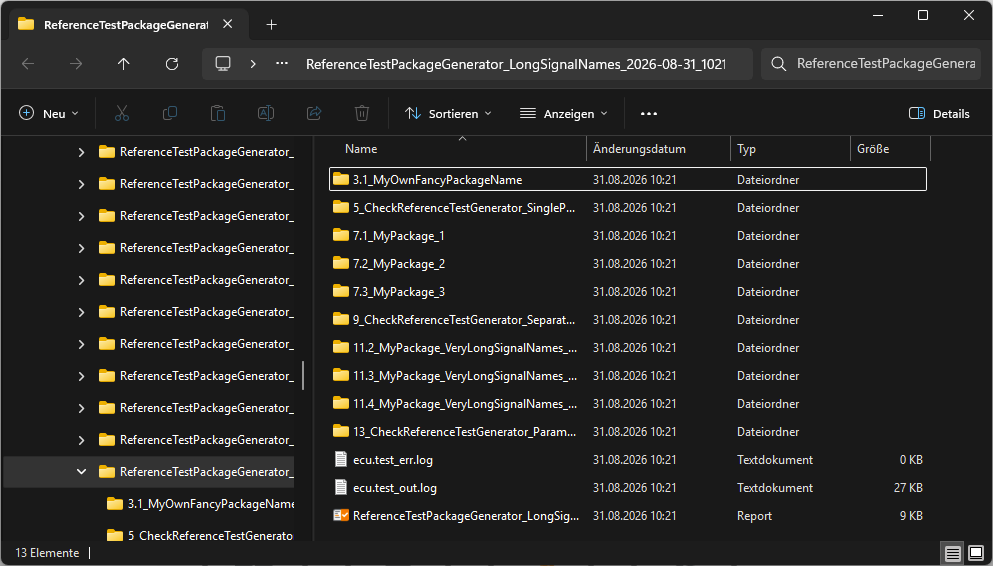
Log directories and package subfolders in the project report are now prefixed with the line number of the respective project component. This prevents results from project components from occasionally overwriting each other. The correct folder name can be retrieved via the following APIs:
- Internal API: api.TestEnvironment.ExecutionInfo.LogFolder
- Object API: Package.GetSubReportPath()
- Report API: Package.GetSubReportPath()
Backups for workspace incompatibilities during ecu.test updates
Due to the new workspace compatibility capabilities, the automatic backup of workspace settings has been removed. As a result, a ZIP archive of the old files will no longer be created automatically as a backup going forward. The corresponding info dialog shown at ecu.test startup has also been removed. If you choose to work without workspace compatibility, we recommend using an SCM such as Git or performing manual backups.
Creating execution tasks in test.guide
Two execution modes create execution tasks in test.guide as part of their workflow: deferred trace analysis execution and execution distribution via test.guide. Starting with ecu.test 2026.3, the Git URL is now passed through unchanged instead of being normalized to HTTPS. Starting with version 1.224.0, test.guide processes Git URLs independently of the protocol and locates a configured SCM tool regardless of which protocol is used. If updating test.guide isn't possible in the near term and HTTPS normalization is still needed, the previous behavior can be enforced using the following feature flag:
- TG-EXECUTION-TASK-GIT-URL-NORMALIZE-HTTPS
Note This feature flag is only available temporarily and will be removed again with ecu.test 2027.1.
Discontinued features in future versions
Tektronix UTA 12
The tool is no longer available on the market and will be discontinued in ecu.test 2026.4.
QUANCOM
The QLIB API interface for Quancom is no longer compatible with current devices and will be discontinued in ecu.test 2026.4. This discontinuation only affects project reports. Package executions will continue to be saved in the TRF format.
Siemens Polarion
The integrated test management adapter for Siemens Polarion will be removed with ecu.test 2027.1. As a replacement the user defined test management adapters can be used. These adapters offer significantly more flexibility and enable optimal adaptation to the respective workflow. A sample workflow is provided to assist with your own implementation.
IBM Rational Quality Manager (RQM)
The integrated test management adapter for IBM Rational Quality Manager (RQM) will be removed withecu.test 2027.1. As a replacement the user defined test management adapters can be used. These adapters offer significantly more flexibility and enable optimal adaptation to the respective workflow. A sample workflow is provided to assist with your own implementation.
HP Application Lifecycle Management (ALM)
The built-in HP Application Lifecycle Management (ALM) test management adapter will be removed inecu.test 2027.1. For continued interaction with HP Application Lifecycle Management (ALM) after that release, a user-defined test management adapter needs to be implemented using the ecu.test Test Management API.
PTC Integrity
The built-in PTC Integrity test management adapter will be removed in ecu.test 2027.1. For continued interaction with PTC Integrity after that release, a user-defined test management adapter needs to be implemented using the ecu.test Test Management API.
Interactive test execution in ecu.test
The use cases for interactive test execution within ecu.test and the web application ecu.test drive largely overlap.
ecu.test drive is the significantly more flexible solution.
- More intuitive user guidance
- Better adaptability to the areas of application in the vehicle
- Usability with runner and remote through decoupling from ecu.test GUI
We will therefore focus on this solution in the future and will remove interactive test execution with ecu.test 2027.1.
Extended interface for UserSynchronization
Going forward, the Synchronize() method will be called with two additional parameters:
- masterRecordingInfo
- recordingInfo
Existing implementations need to be updated soon. Starting with ecu.test 2027.1, the old interface will no longer be supported.
Bus monitoring test steps in ecu.test
Bus monitoring test steps for checking timings and DLC can be implemented significantly better using trace analysis and the included analysis modules. Support for executing these test steps will be removed at the earliest with ecu.test 2027.1.