Reference timing diagram-based trace step templates
Timing diagram fundamentals
Timing diagrams are a graphical specification language that can be used to describe, observe and validate signal value patterns and to compute characteristic quantitative values for a given trace. In ecu.test timing diagram based trace step templates are created and edited with a graphical diagram editor.
General structure of timing diagrams
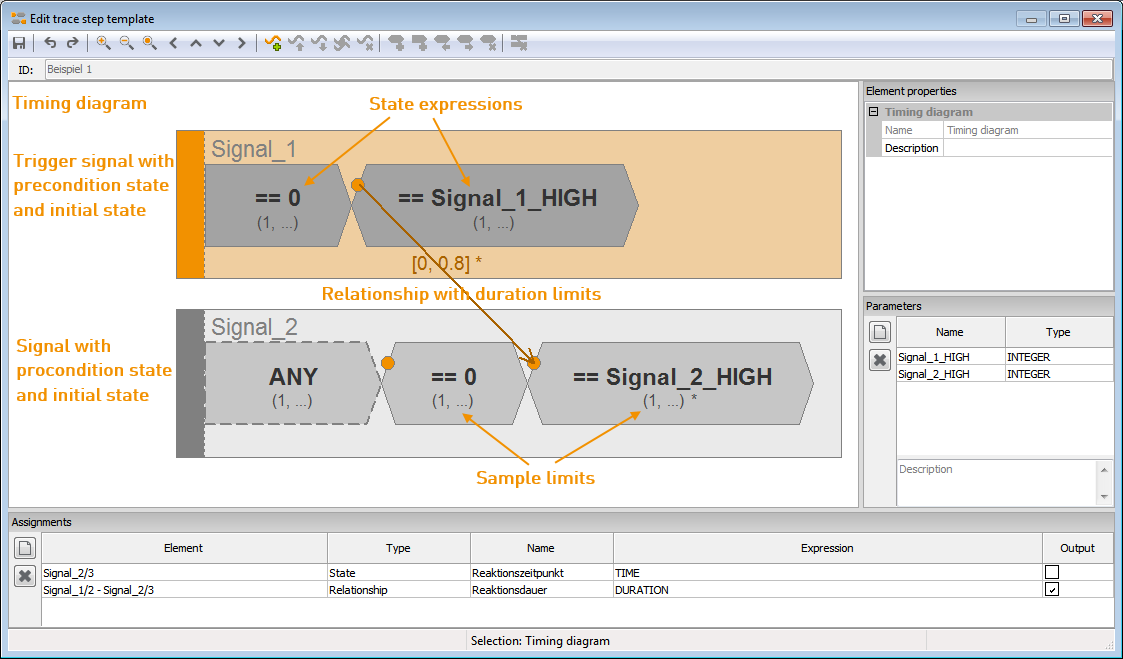
Timing diagrams allow the specification of complex signal patterns as sequences of allowed signal values and signal value changes. A timing diagram has a two-dimensional representation and consists of at least one signal. The time proceeds in positive direction along the abscissa (x-axis). The ordinate (y-axis) contains the different signals considered for an analysis run.
A signal has pentagonal- or hexagonal-shaped states that are labeled with an expression (in bold, first line within the state) and sample limits (light gray, second line within the state). The first signal is called trigger signal. The first state (always present, pentagonal) of the trigger signal is called precondition state, the second state (also always present) of this signal is called initial state. Other signals of the diagram contain an optional precondition state.
The temporal order of state transitions defined by a timing diagram only relates to a single signal. Temporal dependencies between state transitions of different signals are formulated with the use of relationships. Relationships are shown as arrows between two states and are labeled with time limits in interval notation [min, max].
Signals, states and relationships are referred to as elements of the diagram. All elements and the parameters have an optional description, which is not used during the analysis.
Signals
Signals have unique signal names and are represented as rectangles. A signal can contain a precondition state (pentagonal-shaped) and an arbitrary number of states, which are represented as hexagons within the signal.
An exception is the first signal of a diagram (trigger signal, orange colored). This signal is always present in a diagram and cannot be deleted or moved. It always has at least two states, namely the precondition state and the initial state. Both the precondition state and the initial state also cannot be deleted or moved.
Info
If a signal does not contain states (empty signal), no requirements are imposed on the values of this signal during execution of the analysis. However, values of empty signals can be addressed within state and assignment expressions of other signals and thereby be used for calculations. The first signal must not be empty.
States
States of signals are shown as hexagons, with the exception of the pentagonal-shaped precondition state (first state of the first signal) and the pentagonal-shaped states which must be activ until the end of the signal. Each state has a state expression and sample limits.
State expressions
Requirements that must apply within states are specified by Python expressions. All signal names, parameter names, and assignment names defined for the timing diagram can be used as identifiers in the Python expression. If, for a given measuring point, a signal contained in the expression does not have a measured value, the last measured value of this signal preceding this measuring point is used (see section The significance of time stamps).
In an expression the current signal value is accessed using the keyword VALUE or via the signal name (e.g. 100 < VALUE < 300 or 100 < signalname < 300). The keyword TIME provides access to the time stamp of the current signal value. For simple signal value comparisons a leading VALUE keyword can be omitted. By this, for example, it is possible to shorten the expressions “VALUE <= 3” or “VALUE == 1” to “<= 3” and “== 1” respectively (possible for the relational operators ‘==’, ‘!=’, ‘<=’,’>=’, ‘<’, ‘>’).
The special expressions “VALUE == ANY”, “== ANY”, and “ANY” are mutually equivalent. They are always evaluated to True, independently of the current measured value. Thereby states can be created that do not specify any concrete signal requirements and accept arbitrary signal values.
An overview of permitted keywords and identifiers for state expressions is given in section Keywords and identifiers.
Info
The only requirement to a state expression is, that, at the moment of its evaluation, it is either True or False. This means that an expression does not necessarily have to refer to the current signal value or its time stamp. However, the evaluation of an expression only takes place when a measured value of the corresponding signal occurs.
Sample limits
The sample limits (min, max) of a state define for how many consecutive signal values the state expression has to apply at least and at most. For values of ‘min’ and ‘max’ all non-negative integer values are allowed. For all states except the precondition states 1 <= min <= max has to apply. For the precondition state of the trigger signal ‘min’ and ‘max’ can also attain the value 0 to express that a diagram is to be activated directly at the trace start (see section Diagram activation). For all other precondition states the samples limits have to be (1, …). To express an arbitrarily large, maximum sample limit, right-open intervals of the form (X, …) can be defined. Furthermore, parameter names can be used as the minimum and maximum sample limits.
Precondition states
Precondition states define the signal behavior immediately before the activation of a timing diagram. The precondition state of the trigger signal has a special role, because it is part of the activation of the timing diagram. This is the reason why this state cannot be deleted. For all other signals the precondition state is optional.
At the activation of the diagram all declared precondition states (without the precondition state of the trigger signal) will be checked for their validity at the last time stamp just before the activation. From the time stamp of the activation the precondition states act like normal states. This means, that a signal will stay in its precondition state as long as its expression evaluates to True and the next state can’t be activated or there is no next state defined. Thus, a precondition state can stay active over the time stamp of the activation of the timing diagram. If there is no precondition state defined for a signal, it will be waiting for activation of its first state. The activation of these states can only be triggered by a measured value for the respective signal and can take place subsequently or simultaneously with the diagram activation. A value measured prior to the diagram activation is not considered.
Last state of a signal
For the last state of a signal the optional requirement can be specified that the states expression must be true until the end of the signal (until the last sample), however, the sample limits must still be fulfilled.
Relationships
Relationships are used to specify temporal dependencies between two different states. A timing relationship is shown as an arrow from the source state to the target state.
For relationships the following applies:
Precondition states and initial state of the diagram cannot be the target of a relationship. Precondition states may also not be the source of a relationship.
By defining several relationships cyclic dependencies must not arise as these cycles cannot be resolved during the analysis. The creation of cyclic dependencies is already prevented by the diagram editor.
A state must not be source and target of a single relationship.
It is not possible to create relationships to previous states within a signal.
Duration limits
The duration limits [min, max] of a relationship define how much trace time may elapse between the source and target of the relationship. For values of ‘min’ and ‘max’ all non-negative floating point values are allowed, where 0 <= min <= max must apply. A relationship with the time limits [0, 0] requires simultaneous state transitions to the source and target states. It is therefore only useful between different signals, since no two states can apply simultaneously within a signal. To express an infinite maximum time limit, right side open intervals of the form [X, …] can be defined. Alternatively, instead of a number a Python expression can be used as a limit, too. The expression can contain calculations and parameter names. Please note that the Python expressions for the duration limits will be resolved once before the evaluation of the diagram.
Assignments
For each state, relationship and timing diagram assignments can be created. If a state or a relationship has an assignment that is indicated by an asterisk (*) at the end of the label of the respective element.
An assignment has a name and an expression and is evaluated if the defining element is satisfied. This means that:
- For state assignments:
The evaluation is performed at the activation of this state, and also for all subsequently incoming measured values, which retain the activation of the state.
- For relationship assignments:
The evaluation is performed at the activation of the target state of the relationship (only possible if the defined duration limits are satisfied).
- For diagram assignments:
The evaluation is performed whenever the entire timing diagram is successfully identified in the trace.
The evaluation of an assignment is done by evaluating its associated expression. The result of this evaluation is saved under the name of the assignment and may be subsequently accessed in other expressions via the assignment name. In addition to the diagram internal use, assignments can be marked as output signals (checkbox Out during assignment definition in the diagram editor) and made available to other trace steps of an episode for further calculations.
Assignment expressions
Analougous to state expressions, assignment expressions are arbitrary Python expressions. All signal names, parameter names, and assignment names defined for the timing diagram can be used as identifiers within the Python expression. If, for a given measuring point, a signal contained in the expression does not have a measured value, the last measured value of this signal preceding this measuring point is used (see section The significance of time stamps).
In an assignment expression the current signal value is accessed using the keyword VALUE or via the signal name. The keyword TIME provides access to the time stamp of the current signal value. For relationships and the timing diagram itself it is also possible to access the actually measured length of time of the defining element using the keyword DURATION. An overview of permitted keywords and identifiers for assignment expressions is given in the following section.
Parameters
Parameters can be used to set certain values only upon use of the timing diagram as a trace step. Thereby the re-usability is increased. The parameters used in a timing diagram have to have unique names. The change of a name of an already referenced parameter (in sample limits of states or in time limits of relationships) are adapted after a request. If you remove a referenced parameter an error message is shown.
The supported data types are STRING, INTEGER, FLOAT, PYOBJECT, BOOLEAN. For sample limits of states only INTEGER is possible since this means the number of possible repeats of a state. For time limits of relationships INTEGER or FLOAT are needed. If an invalid type is chosen for a referenced parameter an error message is shown.
Keywords and identifiers
The following table summarizes the keywords and identifiers usable within expressions, sample limits, and duration limits and explains their specific substitutions or evaluations.
Keyword / Identifier |
Usable at |
Substitution / Evaluation |
Comment |
|---|---|---|---|
VALUE |
state expression,
assignment expression
|
current signal value |
always returns a measured value |
TIME |
state expression,
assignment expression
|
time stamp of current signal value |
|
ANY |
state expression |
True |
equivalent to “VALUE == ANY” and “== ANY”
|
DURATION |
assignment expression of relationships and the timing diagram |
duration of the element |
diagram: duration between activation and
successful termination of the diagram
relationship: duration between activation of
source and target state of the relationship
|
signal name |
state expression,
assignment expression
|
value of corresponding signal |
same signal: always returns a measured value
foreign signal: measured value if signal is
present in current event, otherwise last measured
value; None if no value was measured until now
|
parameter name |
state (expression and
sample limits),
assignment expression,
duration limits
|
value of corresponding parameter |
allowed data types for parameters:
sample limits: non-negative integer values
duration limits: non-negative floating point
values
|
assignment name |
state expression,
assignment expression
|
value of last evaluation of the assignment with this name |
Evaluation of timing diagrams
During analysis measured signal values are matched against the state expressions of the current diagram states so that the diagram is traversed from left to right. The pattern depicted by the diagram is successfully identified if all waveforms are traversed until their final states are reached and satisfied and no timing constraints were violated. The analysis is divided into the tasks diagram activation, diagram processing and completion and reporting of analysis results.
Diagram activation
All timing diagrams have a defined activation condition, which is specified by the precondition state and the initial state (first two states of the trigger signal). Each measuring point within the trace, which satisfies this condition, activates the diagram. Using the sample limits of the precondition state, different types of activation can be formulated:
- Activation only at the trace start
By specifying the sample limits (0, 0) for the precondition state, a diagram can only become activated directly at the trace start. The expression of the initial state becomes evaluated only at the time of the first measurement of the first signal. If the expression is true at this point, the timing diagram is activated. (For this type of activation, the expression of the precondition state has no meaning and is automatically hidden.)
- Activation by transition from the precondition state to the initial state
Sample limits of the form (min, max) with min >= 1 for the precondition state enable the activation of diagrams based on truth values of expressions. In order to activate the corresponding diagram the via (min, max) specified number of signal values must have satisfied the expression of the precondition state and the current signal value must satisfy the expression of the initial state. If this is the case, the diagram is activated with the transition to the initial state.
- Activation at trace start or by transition from precondition state to initial state
Sample limits of the form (0, max) for the precondition state allow both the direct diagram activation at trace start without evaluating the expression of the precondition state and the activation by transition from the precondition state to the initial state.
At each activation a new diagram instance is created and added to the set of the active diagram instances. The created diagram instance performs the evaluation starting at the respective measuring point and records the evaluation results. It has the following state after initialization:
The active state of the first signal is the initial state.
All other signals are in its precondition state (if defined) or are waiting for activation of their first states. Activation of these states can only be triggered by a measured value for the respective signal and can take place subsequently or simultaneously with the diagram activation. A value measured prior to the diagram activation is not considered.
Info
In the case of a very general formulation of the activation condition (many measurement sequences satisfy the transition from precondition state to the initial state), a timing diagram may be activated at many measurement points and, in the worst case at each measurement point of the trace. Depending on the size of the trace, this can lead to poor analysis performance.
Processing of signal values within diagram instances
During the analysis, the active diagram instances receive the measurement values of each signal event and processes them. Every diagram instance tries to progressively pass through the states of each signal from left to right until the last state of each signal is activated and held for the specified number of samples. The active state of the timing diagram is described by the set of all active states of its signals.
The processing of a signal value within a diagram instance is performed depending on the active state of the signal and its successor state with respect to the following rules:
The minimum sample limit of the active signal state is not yet reached.
If the expression of the active state is satisfied with respect to the current signal value, the state stays active and its sample counter is incremented by one. Any existing assignments of the active state are re-evaluated. If the expression of the active state is not satisfied, this diagram instance fails, because the minimum sample limit of the active state cannot be reached anymore.
The minimum sample limit of the active signal state is reached and the expression and all incoming relationships of the following state are satisfied with the current signal value.
In this case, a transition from the current active state to the next state is carried out. Any existing assignments of the following state are evaluated. If the next state is the source of a relationship, the start time of the relationship is initialized with the time stamp of the current signal value.
With the signal value a transition to the next state is not possible but the active state can still be satisfied regarding its expression and maximum sample limits.
The current active state stays activated and its sample counter is incremented by one. Any existing assignments of the active state are re-evaluated.
Neither the active state nor its successor state can be satisfied with the arrival of the signal value.
The analysis of the diagram instance fails and is aborted because the specified state sequence of the signal cannot be identified in the trace.
The active state is the last state of a signal.
After its activation the final state of a signal must be satisfied at least for the number of signal values specified by its sample limits.
In this case the satisfaction of the signal depends on the defined upper sample limit and the presence of the optional attribute “Last state until end of signal”. It is differentiated between four cases:
Upper sample limit is “…”
Upper sample limit is not “…”
Signal has not attribute“Last state until end of signal”By reaching the minimum sample limit the signal will already be satisfied.
The signal will be satisfied if the upper sample limit is reached in prior or simultaneously with the end of the signal (i. e. no further samples are available) or the expression of the state is not evaluated to true with the next measured value.
Signal has attribute“Last state until end of signal”The signal will be satisfied if the expression of the state is evaluated to true for each sample until the end of the signal (i. e. until the last sample).
The signal will be satisfied if the upper sample limit is reached in prior or simultaneously with the end of the signal (i. e. no further samples are available).
Info
If an incoming measured value satisfies both the current active state and also its following state, the transition to the following state is always performed even if this potentially prevents a later successful completion of the diagram.
Termination of diagram instances
The evaluation of a diagram instance succeeds if all signals have been traversed from left to right in accordance with the value, time and sample limit requirements. Thus, the underlying timing diagram is satisfied by the trace section between activation and termination of the diagram instance. Any existing assignments on the diagram level are evaluated upon successful diagram completion.
The evaluation of a diagram instance fails if, for at least one precondition state is violated or at least one signal, with the incoming measurement the value or timing requirements of the current diagram state are violated. In this case, the further evaluation of this diagram instance is aborted. Assignments on diagram level will not be evaluated for failed diagram instances.
Evaluation and error feedback
For timing diagrams, there are two parameters which affect the determination of the analysis verdict and the display of spots in the report:
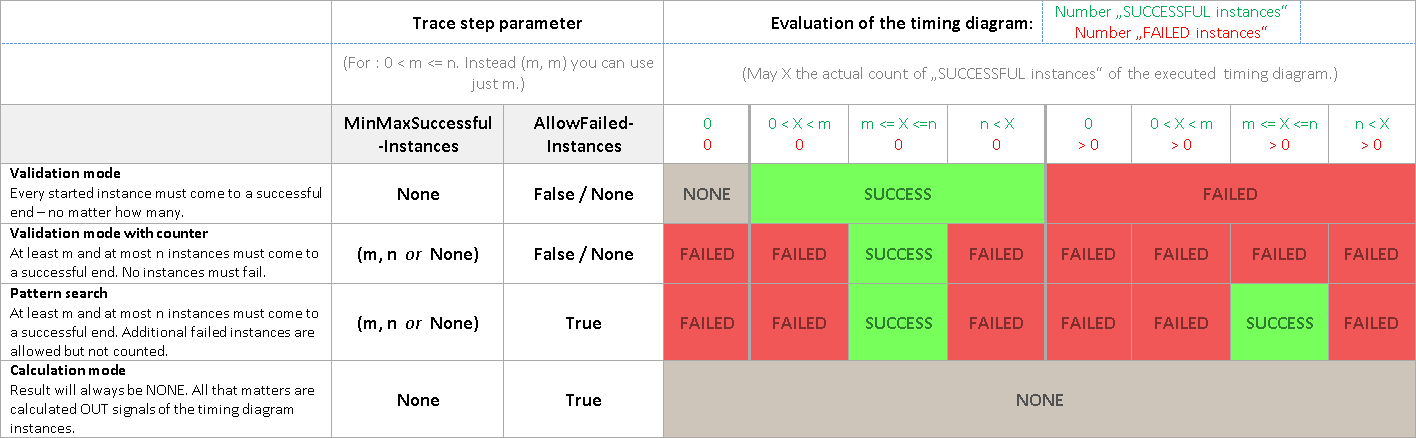
- MinMaxSuccessfulInstances
Specifies how often the timing diagram must run successfully, i. e. how many successful instances are expected (number of “SUCCESSFUL instances”). The value can be a number or a range (two comma-separated values in parentheses). If the actual number differs from the expectation, the trace step is evaluated as “FAILED”. The value can also be None. In this case, the appropriate boundary will not be checked.
- AllowFailedInstances
Specifies if the timing diagram can fail, i. e. if the number of failed instances (“FAILED instances”) is allowed to be greater than zero. The value has to be a boolean value (True or False).
How the trace step evaluates in condition with these two parameters is shown in the following table.
With the options Maximum count and Minimum distance in the trace step template, it can be indicated how many detected diagrams should be reported back and how much time has to have elapsed before the next diagram is reported. Diagrams within this minimum distance are still reported if they have a worse verdict than the diagram with the worst verdict previously displayed in the report.
Detailed results file
In addition to the internal test report ecu.test creates a detailed result file in XML format in the corresponding report directory. (File with extension .xml in the local sub-directory). The result file contains the concrete values and timings gathered during evaluation (e. g. diagram activation and completion times, time stamps for individual state activations, relationship durations) and the results of internal value assignments for each identified diagram and all diagram elements contained therein.