Supported file formats
At present ecu.test supports the following file formats for trace analysis:
Format |
File extension |
Version |
Manufacturer |
Software products (Selection) |
|---|---|---|---|---|
.astrace |
||||
.as3trace |
||||
.asc |
||||
.wav, .flac, .mp3, .ogg |
||||
.blf |
||||
.erg, .erg.info |
||||
.csv |
||||
.dlt |
||||
.hdf5 |
5.0, 5.1 |
|||
none |
3, 4 |
Data logger of the GL family |
||
.mat |
Level 5 MAT-File Format |
|||
.mat |
||||
.mat |
||||
.dat |
2.0, 3.0, 3.1, 3.2, 3.3 |
|||
.dat |
||||
.dat |
||||
.mdf |
||||
.mdf |
||||
.mdf |
||||
.mf4 |
4.0, 4.1, 4.2, 4.3* |
|||
.mf4 |
||||
.osi, .osi.info .txt, .txt.info |
||||
.parquet, .pqt |
||||
.pcap, .pcapng |
||||
.zip |
4, 5, 6, 7, 8, 9 |
|||
.rdb |
||||
.sti, .stz |
2.0.1 |
|||
.tdms |
||||
.ttl |
||||
.avi, .mp4, .mkv, .mts, .wmv |
Generic support via OpenCV |
The following section provides more detailed information about the supported formats. For each format the subsection Parser parameterization describes the meaning of the device name and the format details. These information are set by ecu.test automatically if the recording is done during the test case. Therefore they only have to be considered when the recordings are added manually to trace analysis, e.g via the test step Add trace.
ASC, BLF
- Supported field bus systems
ecu.test supports the bus systems CAN, FlexRay as well as CAN FD, and LIN, and Ethernet (only BLF).
In addition, the extraction and interpretation of diagnostic messages (currently only CAN (FD)) is supported by means of DIAG-SERVICE quantities. See Diagnostics related objects of trace analysis for the structure of the values.
- Selected Frames
For CAN the results CAN (Extended) Message Event and CAN Error Frame that have been defined in the format specification are read, all the other frames are not considered.
For ASC and BLF with FlexRay the so-called FlexRay Message Event is supported in both the “old” and the “new” format (in CANoe/CANalyzer from version 5.2.26). Null frames are always taken into account in the MessageEvent signal and the deprecated Frame signals.
In complete analogy to CAN it is possible to analyze CAN FD messages. The results CAN FD (Extended) Message Event, CAN FD Error Frame for ASC and CAN FD Message 64 defined in the format specification are read, all other frames are not considered.
LIN messages can be analyzed. The events LIN Message Event, LIN Sleep Mode Event, LIN Wakeup Frame and LIN Unexpected Wakeup defined in the format specification are read out, all other frames are not considered. For BLF, please note that outdated LIN loggings from CANoe/CANalyzer up to version 6.0 are not supported.
- Only BLF
Ethernet messages can be read from BLF traces. The Ethernet Packet that has been defined in the format specification is supported. Values of service-based communication can be accessed in a similar way to the PCAP format.
- Multiplexing
The multiplexing of frames is supported for CAN and Flexray. This means that, depending on the Multiplex ID (located at a defined place within FramePayloads and not provided as pseudo signal) other signals are in different frames of the same FrameID. ecu.test can find out independently, which signals are subject to such a multiplexing by means of the specified signal database.
- Pseudo signals
For the file formats ASC and BLF ecu.test provides – in addition to the actual bus signals – so-called pseudo signals for analysis (in the tab Trace files in the respective file under Signals. Pseudo signals provide the access to raw data of the file without the need of a loaded Signal database. If a signal database is loaded the elements listed in tab BUS can be used by ecu.test to extract concrete signals from raw data and provide them in the trace analysis.
Info
The pseudo signals are based on the format specifications for ASC and BLF and provide content that results directly from the raw data. There is no further interpretation of the data (i.e. no calculation of the bus statistics by ecu.test).
Info
The ethernet pseudo signals in BLF also support the access to higher level layers in the same way as PCAP. For details see PCAP Pseudo signals.
Depending on the medium to read there are different pseudo signals available:
Signal
Description
CAN
CANFD
FlexRay
LIN
Ethernet
Data type
MessageEvent
All types of frames (e.g. Error Frame and CAN Remote Frame).
+
+
+
+
-
ErrorEvent
Only ASC. Error entries by bus hardware
+
+
+
-
-
BusStatisticsEvent
Only ASC. Statistic of frames and busload
+
+
-
-
-
OverloadFrameEvent
Only ASC. Overload of bus participants
+
+
-
-
-
StartCycleEvent
Only ASC. Start of a FlexRay cycle
-
-
+
-
-
StatusEvent
Only ASC. FlexRay status entry
-
-
+
-
-
SleepModeEvent
Initial state or change of the sleep mode
-
-
-
+
-
WakeupFrame
A wakeup request
-
-
-
+
-
UnexpectedWakeup
CANoe/CANanlyzer detected an unexpected byte in the bus idle phase of the wake mode that could be a wakeup frame.
-
-
-
+
-
J1939Message
Requires ecu.test diagnostics. J1939 message
+
-
-
-
-
J1939DTCList
Requires ecu.test diagnostics. List of J1939 diagnostic trouble codes
+
-
-
-
-
UdsMessage
Requires ecu.test diagnostics. Unified Diagnostics Services (UDS) messages
+
+
-
-
-
FrameID
Deprecated. Is also emitted if a FlexRay Error Frame occurs
+
+
+
+
-
Integer
FramePayload
Deprecated. Is also emitted if a FlexRay Error Frame occurs
+
+
+
+
-
String
FrameLength
Deprecated. Is also emitted if a FlexRay Error Frame occurs
+
+
+
+
-
Integer
FrameCycle
Deprecated.Is also emitted if a FlexRay Error Frame occurs
-
-
+
-
-
Integer
ErrorFrame
Deprecated. Has a sample with value 1 if an Error Frame occurs.
+
+
+
-
-
Integer
ErrorFrameECC
Deprecated. Like “ErrorFrame”. Contains the value of the ECC register if available, else 0.
+
+
+
-
-
Integer
PacketEthernet
Only BLF. An arbitrary Ethernet frame in the recording
-
-
-
-
+
PacketIp
Only BLF. Ethernet frame of the protocol type IP, no automatic detection of IP fragments
-
-
-
-
+
PacketIcmp
Only BLF. IP packet of the protocol type ICMP
-
-
-
-
+
PacketTcp
Only BLF. IP packet of the protocol type TCP, no support of TCP reassembling
-
-
-
-
+
PacketUdp
Only BLF. IP packet of the protocol type UDP
-
-
-
-
+
PacketSomeIp
Only BLF. TCP or UDP packet with the source port or destination port 30490 is interpreted as SOME/IP packet
-
-
-
-
+
PacketSomeIpSd
Only BLF. SOME/IP packet with the message ID 0xFFFF8100
-
-
-
-
+
PTP/PacketPtpSync
Only BLF. Ethernet frame of the protocol type PTP and the PTP message type Sync
-
-
-
-
+
PTP/PacketPtpFollowUp
Only BLF. Ethernet frame of the protocol type PTP and the PTP message type Follow_Up
-
-
-
-
+
PTP/PacketPdelayReq
Only BLF. Ethernet frame of the protocol type PTP and the PTP message type Pdelay_Req
-
-
-
-
+
PTP/PacketPdelayResp
Only BLF. Ethernet frame of the protocol type PTP and the PTP message type Pdelay_Resp
-
-
-
-
+
PTP/PacketPdelayRespFollowUp
Only BLF. Ethernet frame of the protocol type PTP and the PTP message type Pdelay_Resp_Follow_UP
-
-
-
-
+
Info
Take care when using ErrorFrame: By default, only valid messages are considered for FrameID, FramePayload, FrameLength and FrameCycle. However, if ErrorFrame is also read, the messages marked as error frame are taken into account, and samples are added to FrameID, FramePayload, FrameLength and FrameCycle. Within the trace analysis, you may have to make sure that only the samples of valid messages are analyzed (add check for ErrorFrame).
- Parser parameterization
- Device name
- Purpose:
Not necessary
- Format details (see Management of signals)
- Purpose:
Format details serve as filter in order to only read specific frames of the trace.
- Structure:
%Medium%_%Channel%_%Direction%[_%OptionalParameters%](ASC) resp.%Medium%_%Channel%_%Direction%_%Port%[_%OptionalParameters%](BLF)- Medium
The bus that shall be filtered.
Possible values:
AUTO .. The first frame in ASC is evaluated and the corresponding BUS is set as medium. (If the first frame is of type “CANFD”, “CAN” is set as medium to support mixed recordings.)
CAN ..
BLF format: Frames from both CAN and CAN FD are read.
ASC format: If the value ALL is specified for Channel, messages from both CAN and CAN FD are read. Otherwise it is automatically determined if a CAN or a CAN FD has been recorded on the specified channel. Only matching entries are read.
CANFD .. Only frames from CAN FD are read (only ASC format).
FlexRay .. Only frames from FlexRay are read.
LIN .. Only frames from LIN are read.
Ethernet .. Only Ethernet frames are read (only BLF format).
- Channel
Only frames from this channel are read.
Possible values:
%Number% .. The number of the channel. Valid values for CAN are 1-99; for LIN 1-64.
ALL .. Reads the frames of all channels and treats them as one single trace. Should only be used provided that only one channel exists in ASC.
- Direction
Only frames are read that have been sent into a certain direction.
Possible values:
Rx .. Only received frames are read.
Tx .. Only sent frames are read.
RxTx .. Received and sent frames are read.
- Port
Specifies the UDP port on which the SOME/IP service discovery control data flow is transmitted. On the one hand, the event sender will be identified by the configured IP address, the transport protocol and the port which all are deposited in the service database (Fibex). In that case, the port specified here is not considered. On the other hand, for determining the event sender the control data flow (SOME/IP service discovery) will be analyzed dynamically. In that case, the port specified here is taken into account.
- Optional parameters
List of optional parameters (the square brackets stand for “optional” and are not to be entered). Parameters must be separated by
_.Possible parameters:
idMask=%HexadezimaleZahl% .. Mask for CAN-IDs which allows for ignoring certain bits of the CAN-IDs.
j1939mode .. If this flag is set and
idMaskis not set explicitly,idMask=0x3ffffffis applied.
- Standard:
AUTO_ALL_RxTx(ASC) resp.AUTO_ALL_RxTx_30490(BLF)
ASTRACE
- File types:
The parser supports all kinds of ASTRACE files, i.e.
those that were generated by a trace analysis to integrate the trace.xplorer
those that were recorded using the auto.spy analyzer
- Signal types:
The parser supports all kinds of signals that can be stored in an ASTRACE file, including video signals.
- Parser parameterization
- Device name
- Purpose:
Not necessary
- Format details (see Management of signals)
- Purpose:
Unused
AS3TRACE
- File types:
The parser supports all kinds of AS3TRACE files, i.e.
those that were generated by a trace analysis to integrate the trace.xplorer
those that were recorded with ecu.test using the tool FEP
those that were recorded using the auto.spy analyzer
- Signal types:
The parser supports all kinds of signals that can be stored in an AS3TRACE file, including video signals.
- Parser parameterization
- Device name
- Purpose:
Not necessary
- Format details (see Management of signals)
- Purpose:
Unused
CSV
- Signal types
The following signal types are supported:
Interpreted (Number)
Signal values are converted into floating point values
A faulty conversion leads to an error
Raw value
Signal values are converted to Unicode
Interpreted (String)
Signal values are converted to Unicode
- Parser parameterization
- Device name
- Purpose:
Not necessary
- Format details (see Management of signals)
- Purpose:
The format details contain information about the structure of the CSV. The parser needs those in order to correctly read the file.
- Structure:
The string comprises of one ore more keyword value pairs, whereby the sequence is irrelevant. A keyword value pair is specified as follows:
%Keyword%: '%Value%'Attention: The value is always enclosed by simple quotation marks, independent of it being a character, a string or a number. The following keywords can be specified:
- columnSeparator
The character that separates the individual columns. To specify the tabulator as separator, use
-->as value.Default configuration:
;- decimalSeparator
The character that separates pre-decimal position and post-decimal position of a floating point value.
Default configuration:
.- thousandSeparator
The sign for digit grouping.
Default configuration:
,- headLineNumber
The line number in which the column headings can be found (counting starts with 0).
If -1 is specified as value no headings exist. Thus the first line of the file is already a data line.
If a value greater than 0 is specified the lines 0 until headLineNumber -1 are ignored.
Default configuration:
0- timeColumn
The column that contains the time stamp of the recording.
If the value is a digit it represents the column number (counting starts at 0).
If the value is a character string, it represents column headings.
Default configuration:
0
- Standard:
columnSeparator: ';', decimalSeparator: '.', thousandSeparator: ',', headLineNumber: '0', timeColumn: '0'`
DLT
- General
DLT ((AUTOSAR standard “Diagnostic Log and Trace”) files (.dlt) contain recorded DLT messages. DLT distinguishes between between verbose and non-verbose messages. Verbose messages contain all necessary information to interpret their contents. They contain so-called arguments, which are addressed either by a name or their index. To interpret the content of non-verbose messages, an external database is required - similar to bus communication.
To read DLT, it is necessary to create a control unit in the test configuration. Especially the section “Logging” must be filled. More detailed descriptions of the individual fields can be found in their tooltips.
- Non-verbose DLT
A DLT-FIBEX database is required to read non-verbose DLTs. However, its structure differs from a regular FIBEX. See also AUTOSAR Log and Trace Protocol Specification, Release 1.5.1, page 27. The file path to the database must be stored in the test configuration.
Once the configuration is started, available signals are listed in the Logging tab and can be made available for trace analysis by dragging and dropping them into the Signal recordings tab.
- Verbose DLT
A DLT filter file (.dlf) is required to read verbose DLT. The path to the filter file must be stored in the test configuration. Currently, it is necessary to create it via the DLT Viewer (GitHub).
Once the configuration is started, so-called “filtered logging messages” are available based on the filters in the filter file, which can be read like signals. The read values are of the type DltMessage.
Currently, ecu.test supports the DLT standard version 1. To ensure optimal compatibility with the DLT Viewer and its filter mechanism, the field Type Format (TYFM) from the DLT standard version 2 is also supported.
- Pseudo signals
For general access to DLT messages a signal called DltMessage is provided. Analogous to verbose DLT, the values of this signal are also of the type DltMessage. It should be noted, however, that the messages are read in unfiltered. Thus, verbose and non-verbose messages are read in simultaneously. A distinction between the messages must be made manually in the trace analysis. To differentiate between verbose/non-verbose, for example, you can check for the attribute .verbose.
- Parser parameterization
- Device name
- Purpose:
Not necessary
- Format details (see Management of signals)
- Purpose:
Unused
- Sorting timestamps
For recordings that do not have a strictly monotonous time axis, the following workspace setting can be used: ETHERNET, DLT: Sort timestamps via moving window
ECAL
- General
eCal recordings are stored as HDF5 and contain arbitrary data structures serialized with Protobuf. ecu.test decomposes these partly nested data structures into their basic components and provides them for analysis. For parsing an installed eCAL framework in at least version 5.0 is required. Since the availability of signals can change with time, the whole recording is parsed upon first usage to extract all signals present. Depending on the recording size this process can take some time. The metadata obtained is then written to a .info file in the same directory, which is used for subsequent analysis.
- Signal types
The following signal types are supported:
Interpreted (Number)
All common primitive data types of Protobuf are supported. This includes integers, floating point and long.
Additionally boolean values can be used natively.
Interpreted (String)
Signals can be used as unicode or byte string according to their Protobuf definition.
- Parser parameterization
- Device name
- Purpose:
Not necessary
- Format details (see Management of signals)
- Purpose:
Unused
ERG
For the trace analysis two different files are needed. The *.erg file consists of the recording data, the *.erg.info file
contains of the signal descriptions. Both files must have the same basename. The recording must contain the signal (Quantity) “Time”.
- Signal types
The following signal types are supported:
Raw value
- Parser parameterization
- Device name
- Purpose:
Not necessary
- Format details (see Management of signals)
- Purpose:
Unused
GIN
- General
ecu.test supports the directly created raw data format of the G.i.N. data loggers. The root directory with its data directories (e.g. !D1FX) of the individual ring buffers and additional ethernet loggers (parametrized as ‘logger’) is provided as one single GIN recording. The root directory needs to contain the GiN configuration files ‘ml_rt.ini’ and ‘ml_rt2.ini’ in order to be detected as single GIN recording.
The raw data of classical busses as well as .gfj files containing data of the ethernet traffic are supported.
Caution
.clf files are created from the raw files by the Logger RAW File Decoder, but are not supported!
- Supported field bus systems
ecu.test supports the bus systems CAN (FD), LIN, FlexRay and Ethernet. Analogously to other formats as PCAP, the extraction of various protocols is supported.
In addition, the extraction and interpretation of diagnostic messages (currently only CAN (FD)) is supported by means of DIAG-SERVICE quantities. See Diagnostics related objects of trace analysis for the structure of the values.
Caution
Depending on how the diagnostic database is structured, the signal may contain additional samples with messages that do not actually belong to the selected service. In such cases, additional filtering in the trace analysis based on the raw data is recommended.
- Pseudo signals
Via so-called pseudo signals, it is possible to directly access raw data on the protocol level. That enables access to bus messages without the need of a bus database.
Signal
Description
CAN (FD)
FlexRay
LIN
Data type
MessageEvent
All types of frames (e.g. Error Frame and CAN Remote Frame).
+
+
+
UdsMessage
Requires ecu.test diagnostics. Unified Diagnostics Services (UDS) messages
+
-
-
FrameID
Deprecated. Is also emitted for error frames.
+
+
+
Integer
FramePayload
Deprecated. Is also emitted for error frames.
+
+
+
String
FrameLength
Deprecated. Is also emitted for error frames.
+
+
+
Integer
FrameCycle
Deprecated. Is also emitted for error frames.
-
+
-
Integer
ErrorFrame
Deprecated. Has a sample with value 1 if an error frame occurs.
+
+
-
Integer
PacketEthernet
additional ethernet pseudosignale see PCAP Pseudosignals
- Parser parameterization
- Device name
- Purpose:
Not necessary
- Format details (see Management of signals)
- Purpose:
Format details serve as filter in order to only read specific frames of the trace.
- Structure:
%Medium%_%Logger%:%Channel%_%Direction%- Medium
The bus that is to be filtered.
Possible values:
CAN .. Frames from both CAN and CAN FD are read.
LIN .. Only frames from LIN are read.
FlexRay .. Only frames from FlexRay are read.
Ethernet .. Only Ethernet frames are read.
- Logger
The logger to parse the data from depicted by the index m in the file and directory names, e.g. ‘!D*m*FX’
- Possible values:
%String% .. The logger 0 (trip odometer), 1, 2, 3, E1, E2, or E3
- Channel
Only frames from this logical channel are read. The logical channel is converted to the internal channel with respect to the configuration defined in the ‘ml_rt2.ini’ (e.g. the CAN mapping).
Possible values:
%String% .. The number of the channel. 1A, 1B, 2A or 2B for FlexRay.
- Direction
Only frames are read that have been sent into a certain direction.
Possible values:
Rx .. Only received frames are read.
Tx .. Only sent frames are read.
RxTx .. Received and sent frames are read.
- Standard:
CAN_1:1_RxTx
MDF (version 2.x, 3.x)
Note
MDF 4.3 is currently supported only to a minimal extent. At the moment, this covers reading MDF4 files with ZSTD-compressed DZ blocks. General support for further MDF 4.3 specific extensions is currently not guaranteed.
- Selected blocks
For the MDF format, the blocks that have been defined in the format specification, IDBLOCK, HDBLOCK, TXBLOCK, DGBLOCK, CGBLOCK, CNBLOCK, CCBLOCK, CDBLOCK and CEBLOCK are read by ecu.test.
- Interpreted values
The CCBLOCK (Channel Conversion Block) specifies several conversion formula for converting read raw values into physical values. Currently the following conversion formula are supported:
parametric, linear
tabular with interpolation
tabular
polynomial function with 6 parameters
exponential functions
logarithm function
rational conversion formula
textual conversion formula (like ASAM MCD-2 MC V1.6.0 text formula)
tabular (textual)
tabular (range)
1:1 conversion
- Unsupported signal types
Signals of type curve and map are not supported for MDF files created by INCA (file extension .dat).
- Oddities of characteristics in INCA recordings
When recording MDF3 files with INCA, measurement and calibration variables are stored under the same device by default. While measurement variables are sampled with a certain rate, calibration variables are recorded event-based: A sample is only written to the recording file if the value of the calibration variable changes (or additionally at the start and end of recording).
If, however, the option “Capture calibration variables as measurements” has been selected, the calibration variable are sampled analogously to measurement variables with a certain rate. However, the calibration variables recorded as measurements are no longer located under the same device as the measurement variables in the recording: If, for example, the measurement variables are stored under the device “CCP:1”, then the calibration variables recorded as measurements are stored under the device “CCP:1#MeasureCal”. A recording can even contain one and the same calibration variable under both devices (recorded once event-based and once sampled with a certain rate).
Despite the different devices, adding INCA MDF3 recordings to packages requires only one signal resp. recording group. The MeasureCal device should never be used, since ecu.test always accesses the calibration variables under the MeasureCal device, regardless of the specified device, but measurement variables cannot be resolved if this device is specified.
- Parser parameterization
- Device name
- Purpose:
Mandatory. Is used to select a specific device from the file. Signals are filtered correspondingly. If signals of an additional device are to be read the recording must be assigned to another recording group analogously.
- Format details (see Management of signals)
- Purpose:
Only for multi-processor recordings of ControlDesk when passing “multiprocessor” as device name: Assignment of the device names in the file to the device names of the test configuration.
- Structure:
Platform device pairs in the form
%Platform1%=%Device1%##%Platform2%=%Device2%...- Example:
Platform=Master##Platform_2=Slave
MDF4
- Base Features
MDF specification: 4.2.0
General support for reading signals of tab “Trace files”, “Bus access”, “Measurement”, “Calibration”, “Model”, and “Service”
Reading signal names and signal source names from file (unsupported signals (see below) are not shown by ecu.test)
Extraction of signal data as raw value and as interpreted value (see below)
Reading of compressed signal data
Reading of sorted and unsorted MDF4 files possible
Reading of data from bus logging traces and the extraction of signals using a bus database
Invalidation bits: Signal values will be ignored if the bit is set
“Event” blocks are used to provide pseudo signals (see below)
- Partly supported
New features of MDF 4.2.0 are not yet fully supported. Pending relevant features:
Data type “complex number”
Extension of event blocks with “event signals”
conversion rule “bitfield text table”
Arrays (according MDF4 specification “CN template”):
Simple arrays without axes:
For recordings via the Model or Application port over the Generic XIL-API interface, the “Adapt matrix layout” option of the test bench configuration is taken into account. This ensures consistent use of [Column][Row] matrix addressing in ecu.test for test cases and trace analysis, even if the recording tool internally uses [Row][Column].
Arrays with axes:
Unsupported:
Arrays with more than two dimensions
Arrays with “complex axes” (axes with axes) -> will lead to runtime error
Maps/Curves with changing axes and missing time stamp -> will lead to runtime error
Signals with/within “Nested Compositions” (of Structures/Arrays)
Leaf elements can be read in a regular way.
It is possible to read in the top-level structure node. A structured signal is created. Subelements can be accessed within the trace analysis with the help of attributes. For example in a calculation step: MyStructuredSignal.subSignal > 5.
- Unsupported
Signals without time axis
Arrays according MDF4 specification “CG-Template” and “DG-Template”
Signals from attachments (MDF4 specification: “synchronization channel”)
Signals of data type “MIME sample/stream”
- Unused file content
ecu.test ignores the following MDF file content:
Metadata of the header block
“Channel Hierarchy” block
“Attachment” block
“Sample Reduction” block and “Reduction Data” block
“Input/output/comparison channels” of CA blocks
- Pseudo signals
Two different types of pseudo signals are currently available for MDF4 files.
This first type of pseudo-signal is placed directly at the file level and derives its values from so-called event blocks of the MDF4 file:
Pseudo signal Events.isRecording
A pseuso signal “isRecording”, which has the value 1 when the recording is active and the value 0 when the recording is paused, is built from “event” blocks for recording control (start/stop recording). Checks in trace analysis can thus be restricted to intervals where the recording has been active using a trigger block.
Even if there are no “event” blocks for recording control, the “isRecording” signal with value 1 at the first time stamp is created using metadata.
Most tools generate multiple recording files when using the start/stop trace test step. A trace analysis is performed once for each recording file. Trace recording with INCA is a special case. If you record in MDF3 format, multiple recordings are created within one file. Thus, several trace analyses are executed. This behaviour changes with MDF4. In MDF4, there is only one recording with pauses.
Info
To filter recording pauses in INCA recordings, it is advisable to use the “isRecording” signal.
Pseudosignal Events.Marker
An object per timestamp that is either a spot or defining the start or the end of a range. The attributes isPoint, isRangeStart, isRangeStop are available for distinction.
More information can be accessed via the attributes name and comment. In case a marker has been set by the XIL-API, the attribute xilId can be used.
It is also possible to adress individual attributes directly as a signal, e.g. “Marker.name”.
The second type are the pseudo signals for bus logging, which allow access to messages of specific protocol levels. The provided pseudo signals for Ethernet allow access to upper layer information of the Ethernet stack, e.g. PacketSomeIp.udp.srcPort. For further details about the individual signals and protocol layers refer to the section of the PCAP format. Available pseudo signals for CAN are J1939Message and J1939DTCList to support the diagnostics protocol J1939.
Info
J1939 requires the license option ecu.test diagnostics!
- Bus logging
The MDF4 standard allows uninterpreted messages of the bus communication to be stored. ecu.test is able to read those messages as well as extract signal values based on a bus database.
Supported: CAN(-FD), FlexRay, LIN, Ethernet
The MDF standard provides three variants for the storage of bus logging data: <NONE> unfiltered, <BUS> structured by bus channel and <ID> ID-based (by message). The <BUS> and <NONE> modes are supported, whereby in the <NONE> mode the device assignment must be extended by concrete buses with channel number such as “CAN2” (instead of “CAN”).
For Ethernet bus loggings that - contrary to the standard - do not have a strictly monotonous time axis, the following workspace setting can be used: ETHERNET: Sort timestamps via moving window
Ethernet bus logging supports the following protocols:
SOME/IP
DLT Verbose and Non-Verbose (setting a device name in the format details is mandatory)
SocketAdaptor frames with MACsec
- Oddities of characteristics in INCA recordings
When recording MDF4 files with INCA, calibration variables are stored by default under the device “EtasCalibrationRecordingDevice” (whereas measurement variables are stored under the device selected by the user). While measurement variables are sampled with a certain rate, calibration variables are recorded event-based: A sample is only written to the recording file if the value of the calibration variable changes (or additionally at the start and end of recording).
If, however, the option “Capture calibration variables as measurements” has been selected, the calibration variables are sampled analogously to measurement variables with a certain rate. However, the calibration variables recorded as measurements are no longer stored under the device “EtasCalibrationRecordingDevice” in the recording: If, for example, the measurement variables are stored under the device “CCP:1”, the calibration variables recorded as measurements are stored under the device “CCP:1#MeasureCal”. A recording can even contain one and the same calibration variable under both devices (recorded once event-based and once sampled with a certain rate).
Despite the different devices, adding INCA MDF4 recordings to packages usually requires only one signal resp. recording group. For this group, the format details should refer to the device of the measurement variables, since ecu.test searches for calibration variables preferably in the MeasureCal device with the “EtasCalibrationRecordingDevice” as fallback option.
When using “EtasCalibrationRecordingDevice” in the FormatDetails, however, the event-based recording of a calibration variable can be accessed explicitly, even if there is also a sample rate based recording of the calibration variable in the file. In this case, however, it must be noted that the measurement and calibration variables must be in separate signal resp. recording groups.
- Specifics of bus signals in ControlDesk recordings
Via the bus port, ecu.test can also record bus signals that originate from the model. To resolve the correct model path, some parameters of the bus port are necessary.
To read such bus signals from the generated recording ecu.test creates a so-called sidecar file (.recsf). This file contains the mapping of the bus path to the model path of the signal. If this file is not present, it is not possible to read bus signals from the recording.
- Bus measurements via AUTOSAR Socket Adaptor
-
Info
If there are multiple system identifiers, it is necessary to create a separate recording group for each.
Info
Currently, there are the following limitations:
Only messages sent over IPv6 via UDP are supported.
IP fragmentation is not supported.
- Parser parameterization
- Device name
- Purpose:
Optional. Is used to select a specific device from the file. Signals are filtered correspondingly. Usually passing the format details is sufficient for the assignment of the device names between the file and the test configuration.
- Format details (see Management of signals)
- Purpose:
Assignment of the device names in the file (as the tool calls them) to the device names of the test configuration (as ecu.test calls them).
- Structure:
Device device pairs in the form
%Device in file 1%=%Device1%##%Device in file 2%=%Device2%...- Example:
CAN-Monitoring:1=A-CAN##XCP:1=DME1_DDE1- Example:
Platform=Master##Platform_2=Slave
MAT
- Structure
The files written by MATLAB/Simulink, ecu.test and trace.check show the following inner structure:
MAT file format 5
Struct.Header.time = [0]
Struct.Header.signal = [1]
Struct.Data = [timeDataVector; signalDataVector]
The documentation of the inner structure of files created by ControlDesk can be found in the specific user manual.
- Parser parameterization
- Device name
- Purpose:
Optional. Is only used for MAT-Files of ControlDesk, to select a specific device from the file. Signals are filtered correspondingly. If signals of an additional device are to be read the recording must be assigned to another recording group analogously.
- Format details (see Management of signals)
- Purpose:
Only for multi-processor recordings of ControlDesk when passing “multiprocessor” as device name: Assignment of the device names in the file to the device names of the test configuration.
- Structure:
Platform device pairs in the form
%Platform1%=%Device1%##%Platform2%=%Device2%...- Example:
Platform=Master##Platform_2=Slave
OSI
Two files are needed for the trace analysis. The *.osi or *.txt file contains the recording data,
the *.osi.info or *.txt.info file contains associated metadata to determine the type of OSI recording.
Both files must have the same name beginning.
- Parser parameterization
- Device name
- Purpose:
Not necessary
- Format details (see Management of signals)
- Purpose:
Unused
PARQUET
- General
Apache Parquet is an open source, column-oriented data file format, which is mainly used in the field of Big Data. By default, the columns contained therein are offered as signals.
ecu.test offers several options that can be used to implement more complex use cases based on the parquet format.
Partitioned parquet files, where constant column values are modeled in a folder structure, are not supported.
- Time axis
The column to be used as time axis can be configured. Additionally it is possible to specify the unit in which the timestamps are stored. When reading in timestamps, they are automatically converted into seconds, to ensure that the time axis is compatible with signals from other file formats. In addition, timestamps can optionally be normalized, resulting in relative timestamps starting at 0.0.
- Split parquet files
Split parquet files, which are separated along the time axis into individual part files, are supported. It is enough to add one part to the signal recordings. All remaining parquet files in the same directory that stick to the following naming scheme are combined into one data set:
part-<number>-<basename>.<file extension>The number field is expected to start at zero and must have the same number of digits for all file names.Example: - part-000-myfile.parquet - part-001-myfile.parquet
- Eventlog mode
Usually, a parquet file is structured in tabular form. Each column represents a signal, each row a point in time. In contrast to this, the eventlog mode assumes that all signals are interleaved in a single value column. One or more key columns are used to determine the signal identifier belonging to the current value in the value column. The signals offered in ecu.test are formed by combining the key column values with a
/as separator.In the case of split parquet files, only the file used as a proxy is taken into account for determining the available signals.
The following example shows with
"keyColumns":["ecu", "name"]and"valueColumn": "value"the signalsECU1/Sig1(values 42, 45) andECU2/Sig1(value -13):Raw data from parquet file¶ time
ecu
name
value
0.0
ECU1
Sig1
42
1.0
ECU2
Sig1
-13
2.0
ECU1
Sig1
45
Interpreted via Eventlog mode¶ time
ECU1/Sig1
ECU2/Sig1
0.0
42
1.0
-13
2.0
45
- JSON structures
Parquet does not regularly support complex data types. However, it is possible to store structured signal values as JSON. If you select a signal to read it as a structure, a structured signal will be read instead of a simple signal.
- Parser parameterization
- Device name
- Purpose:
Not necessary
- Format details (see Management of signals)
- Purpose:
The format details affect how contents of the file are processed.
- Aufbau:
JSON string with a dictionary of the following structure:
- timeColumn:
[str] Name of the time column. If not set, determined automatically.
- timeUnit:
[str] Unit of timestamps:
ns,µs,ms,s. Default:s.- normalizeTime:
[bool] Normalize timestamps:
true|false. Default:false.- mode:
[str]
simple|eventlog. Default:simple.- keyColumns:
[list[str], only if
"mode":"eventlog"] List of key columns- valueColumn:
[str, only if
"mode":"eventlog"] Value column
- Example:
{"timeColumn":"time", "timeUnit":"ns", "mode":"eventlog", "keyColumns":["ecu", "name"], "valueColumn":"value"}
PCAP/PCAPNG
- General
PCAP and PCAPNG are formats for network data recording.
- Pseudo signals
For the analysis of this file format so-called pseudo signals are provided. With those you are able to define the corresponding point of entry in the hierarchical constructed network layers. Each of those pseudo signals, when occurring, is returned as Python data structure (see Ethernet API documentation). Please note that raw value always is to be set as signal type, since a closer interpretation of the signal is impossible.
The Python data structures mentioned above also provide the ability to access upper protocol information via the .parent attribute directly or retrieve a specific protocol with .FindParent(protocolName). Additionally it is possible to access the protocol directly as attributes, e.g. PacketSomeIp.ip4.src. Contrary to the “native” data types the Protocol types only contain header fields without any payload data because of performance considerations. The complete API documentation is available here: Ethernet.
Hereinafter all pseudo signals and their description are listed:
Signal
Description
Data type
Equivalent Protocol type
PacketEthernet
An arbitrary Ethernet frame in the recording
PacketMka
Ethernet frame of the protocol type MKA
Not supported
PacketIp
Ethernet frame of the protocol type IP
PacketIcmp
IP package of the protocol type ICMP
Not supported
PacketTcp
IP package of the protocol type TCP, no support of TCP reassembling
PacketUdp
IP package of the protocol type UDP
PacketIke
UDP packet of the protocol type IKEv2. By default, UDP packets with source and destination port 500 will be interpreted as IKEv2 packet.
Not supported
PacketSomeIp
TCP or UDP packet of the protocol type SOME/IP. By default, TCP or UDP packets with source or destination port 30490 will be interpreted as SOME/IP packet.
PacketSomeIpSd
SOME/IP package with the message ID 0xFFFF8100
Not supported
PTP
Ethernet frame of the protocol type PTP
Not supported
PTP/PacketPtpSync
Ethernet frame of the protocol type PTP and the PTP message type Sync
Not supported
PTP/PacketPtpFollowUp
Ethernet frame of the protocol type PTP and the PTP message type Follow_Up
Not supported
PTP/PacketPdelayReq
Ethernet frame of the protocol type PTP and the PTP message type Pdelay_Req
Not supported
PTP/PacketPdelayResp
Ethernet frame of the protocol type PTP and the PTP message type Pdelay_Resp
Not supported
PTP/PacketPdelayRespFollowUp
Ethernet frame of the protocol type PTP and the PTP message type Pdelay_Resp_Follow_UP
Not supported
Info
In the case of IP fragmentation, a PacketTcp or PacketUdp is generated at the time of the last fragment. The individual fragments are still available via PacketEthernet and PacketIp.
- Service based Communication
Beside the support for protocol analysis it is possible to analyze PCAP and PCAPNG recordings for methods and events. Available for the analysis are values from the tab Service. The event and method signals as well as their leaf nodes can be used.
- Logging signals
Furthermore, logging messages according to the “Diagnostic Log and Trace” (DLT) protocol can be read. The operating principle is analogous to the DLT format. In order to identify the ECU correctly, it is necessary to specify IP and Port in the test configuration.
Currently only logging messages in UDP packets are supported.
- PLP (Probe Logger Protocol) / TECMP
Also supported are recordings in PLP/TECMP format, which contain messages of type “Ethernet”. The Ethernet frames contained in the PLP/TECMP are unpacked transparently and processed further. The Filtering by ProbeID/DeviceId and BusSpecID/InterfaceID is not possible. Message types other than “Ethernet” are not supported. Instead of the outer PCAP timestamps, the more precise inner timestamps of the PLP/TECMP Data Frames are used for the time axes of the generic signals.
- DTLS (Datagram Transport Layer Security)
It is possible to read DTLS 1.2 encrypted SOME-IP messages via PacketSomeIp. This requires a special key log file with file extension “.keys” and an identical name as the trace file in the same folder. The key log file must contain a matching CLIENT_RANDOM entry for each session to be decrypted. Key log files can be created via Wireshark.
Info
When a NULL cipher is implemented the usage of the key log file is optional. In this case the SOME-IP messages are parsed as well but cannot be checked for authenticity.
- Bus measurements via AUTOSAR Socket Adaptor
It is possible to parse CAN messages which were sent with the Socket Adaptor module. For this purpose it is necessary to set a database with the SOCKET-ADAPTOR channel in the Bus access tab in a test configuration. Afterwards the required bus signals can be used from the Bus access tab of the action window.
The parsing of CAN messages from both UDP and TCP is supported.
- Parser parameterization
- Device name
- Purpose:
Not necessary
- Format details (see Management of signals)
- Purpose:
The details can be used as a filter for event signals and SOME/IP pseudo signals. This settings have no meanings for other pseudo signals.
- Structure:
%Port%- Port
Specifies the UDP port on which the SOME/IP service discovery control data flow is transmitted. On the one hand, the event sender will be identified by the configured IP address, the transport protocol and the port which all are deposited in the service database (Fibex). In that case, the port specified here is not considered. On the other hand, for determining the event sender the control data flow (SOME/IP service discovery) will be analyzed dynamically. In that case, the port specified here is taken into account.
- Standard:
30490
- Filter
- Purpose:
Based on the filter, entries of the file are discarded if they do not meet the filter condition.
The filter is composed of an and-concatenation of comparisons, which can refer to properties of different bus messages or packets in the Ethernet protocol stack. Thus, the filter works similarly to filtering with Wireshark, but uses the namespace of ecu.test.
Example: PacketTcp.tcpSrc == 1234
Supposing only entries containing a PacketTcp with port 1234 are permitted. Since filtering applies to the complete message of the recording, also a PacketEthernet located deeper in the stack is filtered out.
- Sorting timestamps
For recordings that do not have a strictly monotonous time axis, the following workspace setting can be used: ETHERNET: Sort timestamps via moving window
ROS2
- General
Info
Supported are rosbag2 recordings in version 4 up to and including 9. Rosbag2 recordings support different serialization methods. This tool connection currently only supports recordings in CDR version 1 (Common Data Representation) format in little endian without any compression. Only the sqlite3 and mcap storage plugins are supported.
- sqlite3
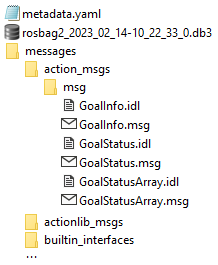
Rosbag2 recordings in the format “sqlite3” are folders containing one or more SQLite files with the extension .db3, as well as an associated metadata.yaml. In order to enable correct recognition of a rosbag2 recording ecu.test expects a zip file. To extract actual data from the recording meta information is required, which must also be contained in the zip file.
To use rosbag2 recordings that were not created with ecu.test, some manual steps are necessary:
Create a new empty folder
Copy alle rosbag2 recording files into the folder (all .db3 files belonging to the recording).
Adding the metadata.yaml to the folder
Until verion Humble Hawksbill collect and add all necessary structure information, which is needed to extract signals from the data (all .msg files). This step can be omitted from Iron Irwini onwards.
Create a zip file with the contents of the entire folder.
Contents of a sample zip file:
- mcap
Rosbag2 recordings in the format “mcap” are folders containing one or more MCAP files with the extension .mcap, as well as an associated metadata.yaml. In order to enable correct recognition of a rosbag2 recording ecu.test expects a zip file.
To use rosbag2 recordings that were not created with ecu.test, some manual steps are necessary:
Create a new empty folder
Copy alle rosbag2 recording files into the folder (all .mcap files belonging to the recording).
Adding the metadata.yaml to the folder
Create a zip file with the contents of the entire folder.
- Parser parameterization
- Device name
- Purpose:
Not necessary
- Format details (see Management of signals)
- Purpose:
Unused
RDB
- General
RDB is a binary format that contains a RDB stream generated by VTD. VTD itself saves these files with a .dat extension, however ecu.test renames it to .rdb to avoid confusion with other formats.
- Signal types
The following signal types are supported:
Integer
Floating point
Unicode strings
- Parser parameterization
- Device name
- Purpose:
Not necessary
- Format details (see Management of signals)
- Purpose:
Unused
STI
- Parser parameterization
- Device name
- Purpose:
Not necessary
- Format details (see Management of signals)
- Purpose:
The format details serve to specify the sample rate.
- Structure:
%Samplerate%- Sample rate
Number of samples per second.
Possible values:
%Number% .. The sample rate as floating point value.
- Standard:
50.0
TDMS
- General
Each group of a TDMS recording can define its own time channel. If all timestamps are absolute, then the earliest timestamp is normalized to zero and used as reference for all other timestamps. If a recording only contains relative timestamps, then the smallest timestamp is normalized to zero and is used as reference. For mixed timestamp types, the earliest absolute timestamp is used as reference and all relative timestamps are relative to that particular absolute reference.
- Parser parameterization
- Device name
- Purpose:
Mandatory. Is used to select a specific device from the file. Signals are filtered correspondingly. If signals of an additional device are to be read the recording must be assigned to another recording group analogously.
- Format details (see Management of signals)
- Purpose:
Unused
TTL
- Supported field bus systems
ecu.test supports the bus systems CAN, CAN-FD, FlexRay und LIN and additionally Ethernet. Clamp 15 and Clamp 30 are provided as analog signals.
In addition, the extraction and interpretation of diagnostic messages (currently only CAN (FD)) is supported by means of DIAG-SERVICE quantities. See Diagnostics related objects of trace analysis for the structure of the values.
- TAPs
TAPs (extension boards) connected to the main logger via Ethernet are supported. Their TAP number (also cascade) needs to be set explicitly in the format details (see below).
- Pseudo signals
For the file format TTL ecu.test provides – in addition to the actual bus signals – so-called pseudo signals for analysis (in the tab Trace files in the respective file under Signals). Pseudo signals provide access to the raw data of the file without the need of a loaded Signal database. If a signal database is loaded, the elements listed in tab BUS can be used by ecu.test to extract concrete signals from the raw data and provide them in the trace analysis.
Depending on the medium to read there are different pseudo signals available:
Signal
Note
CAN/CAN-FD
FlexRay
LIN
Data Type
FrameID
+
+
+
Integer
FramePayload
+
+
+
String
FrameLength
+
+
+
Integer
FrameCycle
-
+
-
Integer
UdsMessage
Requires ecu.test diagnostics.
+
-
-
The available pseudo signals for Ethernet are listed in the following section: PCAP pseudo signals.
- Service based Communication
- Logging signals
- PLP (Probe Logger Protocol) / TECMP
- Bus measurements via AUTOSAR Socket Adaptor
- Parser parameterization
- Device name
- Purpose:
Mandatory. Is used to select a specific device from the file. Signals are filtered correspondingly. If signals of an additional device are to be read, the recording must be assigned to another recording group analogously.
- Possible values:
Analoge Signale, CAN, Flexray, LIN, Ethernet
- Format details (see Management of signals)
- Purpose:
Format details serve as filter in order to only read specific frames from the trace. Analog signals don’t need format details. In older versions a device (‘ANY’, ‘Tricore’, ‘FPGA’) was defined in addition. This is not necessary anymore.
- Structure:
%Medium%_%TAP Number%:%Channel%_%Direction%_%Port%- Medium
The bus that shall be filtered.
Possible values:
CAN .. Only frames from CAN or CAN-FD are read.
Flexray .. Only frames from FlexRay are read.
LIN .. Only frames from LIN are read.
Ethernet .. Only Ethernet frames are read.
- TAP Number:
Only frames from this logger are read.
Possible values:
%Number% .. The number of the TAP. Valid values are 0 to 7, whereas 0 is the main logger.
- Channel
Only frames from this channel are read.
Possible values:
%Number% .. The number of the channel.
Valid values for the main logger are for:
CAN .. 1-24
LIN .. 1-12
FlexRay .. a combination of the FlexRay number 1-3 and the FlexRay channel A, B or AB
Ethernet .. A or B
CAN-FD .. not supported
Valid values for the TAPs are for:
CAN .. 1-5
LIN .. 1-15
FlexRay .. a combination of the FlexRay number 1-2 and the FlexRay channel A or B
Ethernet .. a combination of the numbers 1-6 with A or B
CAN-FD .. 1-15 (I.e. since CAN-FD is contained within the medium CAN, the format details of the channels 1-5 are identical for both.)
- Direction
Only frames are read that have been sent into a certain direction.
Possible values:
Rx .. Only received frames are read.
Tx .. Only sent frames are read.
RxTx .. Received and sent frames are read.
- Port
Specifies the UDP port on which the SOME/IP service discovery control data flow is transmitted. On the one hand, the event sender will be identified by the configured IP address, the transport protocol and the port which all are deposited in the service database (Fibex). In that case, the port specified here is not considered. On the other hand, for determining the event sender the control data flow (SOME/IP service discovery) will be analyzed dynamically. In that case, the port specified here is taken into account.
- Standard:
Flexray_1A_RxTx_30490
AUDIO
- General
ecu.test supports
.wav,.flac,.mp3, and.oggfiles. Each contained audio channel can be read separately. Values are read as 64-bit floating-point number typically in the range from -1.0 to 1.0.- Parser parameterization
- Device name
- Purpose:
Not necessary
- Format details (see Management of signals)
- Purpose:
Unused
VIDEO
- Supported Video Formats
ecu.test uses OpenCV 2.x to read video files. Therefore, it supports all video formats that are supported by OpenCV, with the used video codec being determinative. Currently the following container format are supported: .avi, .mp4, .mkv, .mts.
Caution
OpenCV needs certain DLL libraries that are not shipped by default with some versions of windows. This especially affects Windows 10 N and Windows Server 2012 R2. To use this feature on such machines, you will need to install the corresponding feature packs, for example the Media Feature Pack for Windows 10 or the Windows Server Essentials Media Pack.
Info
OpenCV provides images in color scheme BGR! Before adding an image to the report the color scheme must be converted with e.g. the following call:
rgbArray = cv2.cvtColor(bgrArray, cv2.COLOR_BGR2RGB)- Pseudo signals
For the analysis of frames a signal called Frame is provided. Using this signal yields a Frame object for each time stamp. If a media access is configured, alternatively the top level video signal can be addressed.
The interface of the Frame object can be found in the API documentation.
Info
It is possible to read the attributes number, data and time directly. The pseudo signals Frame.number, Frame.data and Frame.time are to be addressed for this purpose.
If the analysis execution setting for rounding timestamps is set, the frame time is rounded accordingly.
- Parser parameterization
- Device name
- Purpose:
Not necessary
- Format details (see Management of signals)
- Purpose:
Unused