Test execution
ecu.test provides for test execution, in addition to a clearly arranged execution window, a debugger and a check module which are described in more detail in the following section.
The behavior of trace analysis for each execution mode is documented in more detail in The Interface between test and trace analysis.
Execute package
Package and trace analysis execution can be started by means of the respective button on the button bar. By means of the black arrow next to the button you can choose to start only package execution or only trace analysis execution.
The dialog displayed during package execution is shown in the following screenshot:

The dialog consists of three main regions.
The upper region shows the current runtime of the execution and the active execution step. The execution consists of three main parts: Test case, Trace analysis and report creation.
During the execution of the test case, the left region shows an overview of the executed main package including the ratings of already executed steps. The active step is highlighted.
The right region shows the call stack. It consists of the currently executed test step and all sub packages passed to reach this test step.
The buttons at the lower left corner can be used to open the real-time log (Message window as separate window) and to deactivate the automatic scrolling in the package overview.
The current overall result of the execution and the button to abort the execution are positioned at the lower right corner.
Run test case and trace analysis
This button starts test case and trace analysis execution.
Run test case and trace analysis parameterized
ecu.test allows carrying out any test case with a certain assignment of variables. When the respective button has been activated a dialog opens in which all defined variables are laid out clearly. In that dialog the values of variables can be adapted to your ideas.
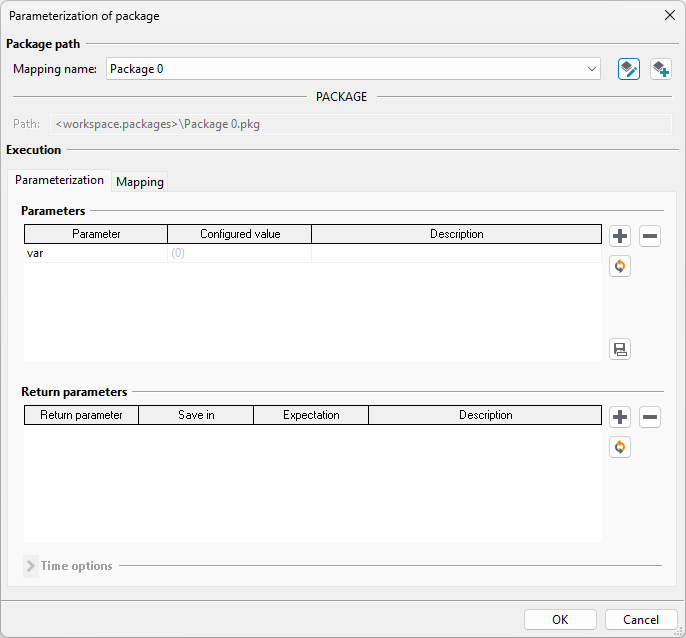
By clicking on OK you confirm the current assignment and so carry out the test case with the desired variable assignment.
Info
If no variables have been defined in a given package the parameterization dialog does not appear.
Run test case
This button starts test case execution. Analysis job of the trace analysis are created but not executed.
Schedule with test.guide
Schedule with test.guide allows you to run a locally edited package on a selected test bench via the test.guide execution distribution. This allows you to test local changes faster without blocking the test bench during development.
Info
It is recommended to start the configuration in Offline mode. This ensures that ecu.test does not establish a connection to the test bench and block it.
The feature is based on a Git workflow. Local changes are pushed to a feature branch such that an execution task can run on it. The local workspace state remains unchanged.
Features:
Selection of local changes for the feature branch.
Additional package references are detected automatically.
Selection of the configuration to use and whether ecu.test should be closed on the test bench after execution. The configuration itself is used unchanged on the test bench, i.e. local changes to the configuration are not pushed to the feature branch.
Execution either on a specific test resource machine or for a specific XIL/Type.
Favorites simplify repeated execution.
Feature branches always follow the format schedule-test-guide/<package name>_<date and time> (e.g. schedule-test-guide/my_package_20260723-170500).
The created feature branch is deleted locally only and remains on the remote repository. With the button Actions… it is possible to delete all remote feature branches at once.
Requirements
The workspace is Git-versioned. ecu.test must be able to create and push a feature branch via Git.
A configured connection between ecu.test and test.guide is required (workspace setting test.guide reports).
The values uploadAuthenticationKey and projectId from the default connection are used.
The auth key needs permissions to create execution tasks.
To query Test Resource Machines, read permission for monitoring data is required.
Info
Extended Git repository rules can reject pushing the feature branch.
- Use case 1: GitHub rule “Require linear history”
As the feature branch is used for execution only, it should be excluded from this rule using an exclusion pattern. For example: schedule-test-guide/*.
- Use case 2: Commit message rule
ecu.test creates one commit with all local changes on the feature branch by default. As in use case 1, you can either use an exclusion pattern or set the ECUTEST_SCHEDULE_TG_COMMIT_MESSAGE_PREFIX environment variable accordingly such that the resulting commit message satisfies the rule.
Run test case and run trace analysis downstream
See Project execution with downstream analysis job execution.
Run trace analysis from current test report
This option makes it possible to re-run the analyses from the current report.
Run trace analysis separately
This button starts test case and trace analysis execution. Since no test case is executed, only manually added recordings in the recording groups are analyzed.
Run package interactively
Via this button the package can be executed in interactive mode. This means that the blocks that are marked as User instruction will be shown in a larger window and the content of action, parameter and expectation will be read loudly from a computer voice. The execution of such blocks is done manually by the tester. More information can be found in chapter Interactive testing.
With the small black arrow next to the start symbol can be chosen between the two execution modes.
Run test case and trace analysis interactively
This button starts test case and trace analysis in interactive mode. The trace analysis offers no special interactive functionality, it will be executed automatically and without user interaction as usual.
Run test case and trace analysis interactively parameterized
This button combines the functionality of the following two:
Run test case interactively
This button starts the test case without trace analysis. The execution without trace analysis is recommended if the results of the trace analysis are not needed immediately and the runtime of the trace analysis shall be saved. The trace analysis can be executed later via menu entry Run trace analysis separately.
Debug package
A debugger is integrated in ecu.test for carrying out a simple analysis if problems arise.
The debugger is started by the button next to “normal” test execution. The arrow next to it allows the choice of carrying out only the test or also a trace analysis (if any).
When the debugger is started execution runs as with a normal start, but only up to the first breakpoint. From there the continued execution can be controlled by means of several options:
continue execution up to next breakpoint
debug reference (this means if the step is a package every single step has to be confirmed in the called package)
carry out next step only (and wait for next action).

Breakpoints are set or removed by the test step context menu (right click on a test step) and represented by a red dot on the test step (see figure).

Evaluate test report
The test report is made available in a database. A database view opens automatically for easy analysis. The test report presents all test steps with their evaluation (SUCCESS, FAILED, ERROR). The evaluation is displayed either by a background color in the table line (this test step has that evaluation) or just by a colored frame. The latter means the test step itself has no evaluation but further test steps are subordinated to it, and thus it is the evaluation of the subordinate test steps that is given ( e.g. in case of package references, block or If-Then-Else steps).
All functions concerning a test report are explained in detail in test report.
Test case coverage
With the test case coverage functionality, the line coverage of individual test steps can be measured during test case execution and then visualized in the package editor.

- Use case
Creation of coverage metrics in terms of quality management
Determination of branches of the test case that have not been entered for the purpose of cleanup
Protection of central user libraries (e.g. library workspaces)
- Activation
To measure the coverage during test execution, this must be activated in the test configuration first:
When uploading reports to test.guide, the associated coverage files are automatically transferred as well.
- Handling
If the coverage measurement has been activated in the test configuration, it is determined directly when a package or project is executed. The line coverage is only visualized within packages.
The visualization is applied to all packages opened in the editor directly after the test case execution.
Via , it is possible to load additional coverage files and reset the visualization.
Coverage files can also be loaded from test.guide via . To do this, a project filter must exist in test.guide that includes the relevant reports. Then, by specifying the project filter ID, all coverage files contained in the filtered reports can be loaded.
Important
The Connection to test.guide must be configured. The test.guide authentication key that is used must belong to a user that has permission to access the project filter.
- Generate a coverage report
Via , it is also possible to create a coverage report that summarizes all currently loaded coverage files. The following files are created:
An XML file containing the merged coverage data
An HTML file with a graphical representation of the test step coverage of all packages within a workspace
A JSON file with detailed coverage information for each package
The HTML representation also makes it possible to open packages in the test case editor and view their test step coverage in detail.
The schema definition of the JSON file is located in the installation directory under
res/schemas.