trace.xplorer
The trace.xplorer enables a very detailed and interactive analysis of recorded measurement data, which can include numerical signals and bus messages as well as video and audio streams. Signals can be viewed, formatted and compared with other signals at high performance. Events can be marked in the trace and time spans or signal amplitudes can be measured.

Each Trace analysis generates a Test report with detailed analysis results when it is executed. The static information contained in this report can be exploratively understood using trace.xplorer. This allows conclusions to be drawn on questions such as:
Should the trace analysis (or even the test case) be corrected, made more robust, or extended?
How exactly did the present evaluation of the system under test (SUT) come about?
How good is the quality of the recorded signal data (measurement resolution, dropouts, outliers, …)?
Does automated testing of ECUs require additional signal data to be recorded?
Variants and differences
In ecu.test, interactive visualization of signal data and test case evaluations is done by default with trace.xplorer basic. If its range of functions is not sufficient, trace.xplorer can help with advanced evaluation of the result data. It requires an extra license and offers additional features compared to the basic variant, for example:
importing, exporting and printing of signal data
deleting unneeded signal data from existing documents
fast event search using simple, logical signal conditions
script-based signal analysis for more complex problems
time shifting of signals
creating and deleting signal groups
configuring additional Wireshark capture interfaces (see Capturing with Wireshark)
While trace.xplorer basic can only display ASTRACE files, trace.xplorer supports the following data formats with its import/export interfaces:
ASTRACE, AS3TRACE
CSV, MDF4, PCAP, PCAPNG, ASC, BLF, TTL
MP4, MKV, AVI, ASF
Configuration
The default program for viewing traces can be changed in the Included programs section
of the local ecu.test settings. The options for storing signal data in trace.xplorer format
(*.astrace) can be found in the workspace settings in the Trace analysis section.
Capturing with Wireshark
The network analyzer software Wireshark offers a versatile way to expand the tool with new capture interfaces using so-called external capture plugins (extcap). When used with third-party software such as Vector XL Driver Library or Vector SIL Kit, the ecu.test component extcap.exe acts as an external capture plugin and enables access to Ethernet, CAN, CAN-FD and LIN in Wireshark.
Setup interfaces
For adding new capture interfaces, the trace.xplorer offers an easy-to-use dialog that can be opened via the menu . Simply select all the interfaces that you want to set up for an existing Wireshark installation. Deselected interfaces will be uninstalled.
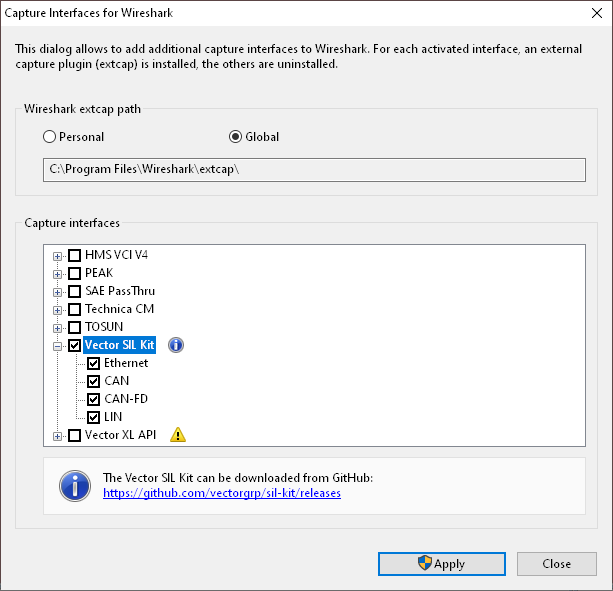
To apply the configuration, Wireshark must be restarted.
Known problems
The described feature will not work, or will have some restrictions if certain Wireshark versions are used. We know about restrictions of the following Wireshark versions:
Wireshark Version |
Problem Description |
4.0.10 |
Recording cannot be started if the configuration uses unchanged default values. https://gitlab.com/wireshark/wireshark/-/issues/19639 |
4.4.0 |
Wireshark searches the wrong directory |