Creating an event-based Python trace step template
Having selected the signal “CarSpeed” for analysis we now have to determine how to analyze it. This is done using a trace step template, by means of which we specify the analysis in general terms (for the time being independently of the concrete recording or signal).
First we create a new trace step template (event-based in our example) in tab Trace step templates at My templates by choosing from the drop down menu (see figure Creating a new event-based Python trace step template). (The section General approach in the manual gives a brief overview over the different types of trace step templates and explains, how to create them.)

Creating a new event-based Python trace step template
A dialog appears (see figure The trace step template “UpperBound”) in which in the section Common we declare the name for our analysis project (more precisely: the ID) “UpperBound”, under which we can use the trace step template in future (1) .

The trace step template “UpperBound”
By clicking on button (2) we generate a new (incoming) signal whose name we use immediately for formulating the rules of analysis. As we need only one signal here we rename it, after double-clicking the automatically generated name “Signal_0”, into “Signal” because it looks better that way. (Our concrete signal “CarSpeed” will later correspond to that general signal).
For the upper boundary in relation to which we want to examine the signal “CarSpeed” we define a parameter (“float” type, “IN” direction) by clicking on button (3). We now assign the expressive name “Threshold” (instead of “Parameter_0”). We define a second parameter named “MaxValue” (“float” type) and set its direction to “OUT”. When executing the trace step template this parameter will store the maximum speed value.
By clicking the button (4) a new function “Next” will be created that will be executed for every sample of Signal. In the edit function dialog we add our analysis code and submit via OK.
#Head of function is generated, do not edit!
def Next(event, hold, dataContainer, parameters, report):
    value = event.GetValue('Signal')
    threshold = parameters['Threshold']

    if parameters['MaxValue'] is None or value > parameters['MaxValue']:
        parameters['MaxValue'] = value

    if value > threshold:
        report.SetResultFailed()
        report.Spot(event.GetTime(), 'Threshold exceeded ({})'.format(value), report.RESULT_ID_FAILED)
The complete trace step template should look like illustrated in the figure The trace step template “UpperBound” above.
We finish editing the trace step template by confirming with OK and see in the explorer view on tab Trace step templates that our trace step template “UpperBound” is now listed there (see figure The trace step template “UpperBound” in the explorer view).
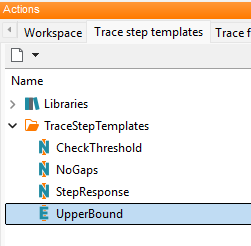
The trace step template “UpperBound” in the explorer view
Before inserting the trace step template “UpperBound” into our trace analysis we create a package variable named “MaximumSpeed”. The parameter with the same name in our trace step template will be assigned to this variable later. In order to create a new package variable we perform a right mouse button click in the section Variables.

Creating a new package variable
Info
No Writing AND Reading of a package variable within one episode
A package variable being written in one episode can not be read in the same episode. Reading is only possible in the next episode.
From the context menu we choose New Variable and Numeric. In the variable settings dialog we change the name to “MaximumSpeed” and confirm by clicking OK. Afterwards we check the checkbox Return value.

The package variable “MaximumSpeed”
In the next step we use our trace step template “UpperBound”. We move the entry in the explorer view (in tab Trace step templates) via drag-and-drop into the empty sector under Episodes and trace steps, to use it in our trace analysis (see figure Using the trace step template “UpperBound”).

Using the trace step template “UpperBound”
In the Trace step configuration dialog we assign our concrete “Signal0” to the generic signal “Signal” in the trace step template. In addition we set the value for the “Threshold” parameter to “75”. In order to bind the parameter “MaxValue” to our package variable we click in the Value cell and press the arrow down key on the keyboard. From the list of suggestions we choose our package variable named “MaximumSpeed”.
The fully parameterized trace step template should look like this:

The parameterized trace step template “UpperBound”
For a visual representation of the signal “CarSpeed” we add a new plot by clicking the
symbol  (“New Plot”) in the Episodes and trace steps section.
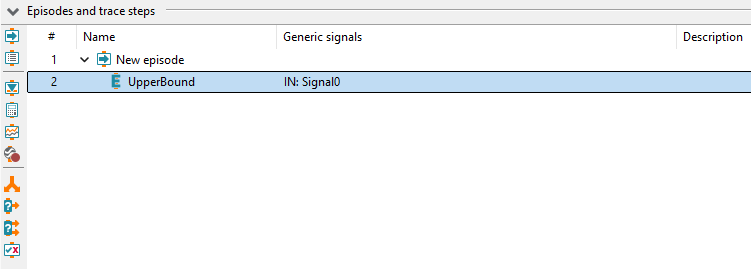
Creating a new plot
We leave the default setting and confirm via OK.
In the Episodes and trace steps section we can now see the simple flow of our trace analysis (see figure The structure of “Trace analysis 1”): There is only one trace step “UpperBound” in the (automatically created) episode (“New Episode”) which processes only one incoming signal “CarSpeed” that is assigned to the generic signal “Signal0”. Our plot is appended to our trace step template.
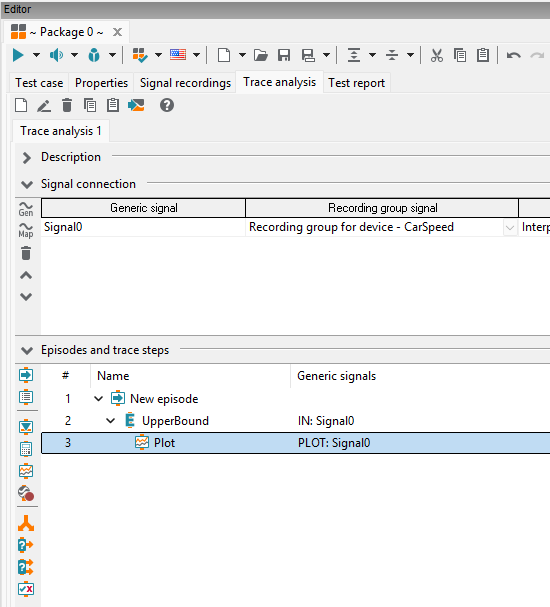
The structure of “Trace analysis 1”
Having executed the trace analysis (see Preceding section) we can see the result in tab Test report. Our trace step “UpperBound” delivers the result FAILED, i.e. for at least one timestamp the signal “CarSpeed” exceeds 75 km/h. By a double clicking on the respective line we can unfold the details of the trace step and find that the speed was exceeded by three samples.

Displaying the test result
Section (1) lists all timestamps where the speed exceeds the threshold.
In section (2) we can see that the speed reaches a maximum of 75.5 km/h.
In section (3) we can see a plot of the signal “CarSpeed”.
Info
Supplied trace step templates
The creation of own trace step templates is an essential strength of ecu.test trace analyses. A step-by-step guide for creating a trace step template is included in the separate section Creating trace step templates. The supplied templates can serve as an inspiration. In the explorer view of ecu.test, they can be arbitrarily copied and renamed (via drag-and-drop or context menu, see Adapting default templates using the example CalculateMinMax).