Creating an array-based NumPy trace step template
Having selected the signal “CarSpeed” for analysis, the actual trace analysis shall now be created. In this tutorial, this is done via an array-based NumPy trace step template, which incorporates the analysis instructions in generic form, aiming for reusability.
To create the trace step template, click on the icon for new trace step templates in the tab Trace Step Templates of the action window and select the entry . (In the manual, the section General approach explains the different types of trace step templates and how to create them.)

Creating a new array-based NumPy trace step template
Make the following entries in the dialog that appears:
In the section Common, enter the name CheckThreshold as ID for the trace step template.
Optionally enter a description text.
In the section Signals, click
 to create an input signal
(direction IN) with the name Signal.
to create an input signal
(direction IN) with the name Signal.In the section Parameter, click
to create the following two parameters:An input parameter (direction IN) named threshold of type FLOAT
An output parameter (direction OUT) named maxValue of type FLOAT
The filled-in dialog should look as follows:

Wizard for creating array-based NumPy trace step templates
Unlike as with other trace step template types, this dialog works as a wizard, i.e. after pressing the Generate button, the contents of the dialog are translated into a Python class, which is named according to the previously specified ID and describes all aspects of the trace step template. This Python class is opened automatically - depending on the current settings either in the Python editor integrated in ecu.test or in an external Python editor.
Note
If you use an external editor, you can enable type checking and auto completion by adding the interfaces shipped with ecu.test. See Trace Analysis API.
The methods GetDescription(), GetSignals() and GetParameters() of the generated class
reflect the settings just made in the dialog and allow subsequent adjustments (It is not possible to
reopen the wizard dialog for changing the Python class once it has been generated!):
@classmethod
def GetDescription(cls):
    """
    Returns the description of the trace step.

    :rtype: unicode
    """
    return 'Checks whether the given signal exceeds the given threshold'
@classmethod
def GetSignals(cls):
    """
    Returns the incoming and outgoing signals of the trace step.

    :rtype: list[SignalDefinition]
    """
    return [
        SignalDefinition('Signal', 'IN', optional=False, description=''),
        ]
@classmethod
def GetParameters(cls):
    """
    Returns the input and return parameters of the trace step.

    :rtype: list[ParameterDefinition]
    """
    return [
        ParameterDefinition('threshold', 'IN', description=''),
        ParameterDefinition('maxValue', 'OUT', description=''),
        ]
The actual analysis rule of the trace step template must be specified within the method
Process() (at the very end of the generated class). Explanations of the parameters of this
method can be found in the generated DocString, the section
Creating array-based NumPy trace step templates and the
Trace analysis API reference.
Concerning the task at hand - the search for threshold violations - the method Process() has to
be implemented as follows:
def Process(self, parameters, report, timeAxis, ranges, signals):
    """
    ...

    """

    # Copy parameters to local variables
    threshold =  parameters['threshold']

    # Maximum value, we have found so far. Initially this is NaN (not a number).
    maxValue = float('NaN')

    # Process() is called only once and receives a list of trigger ranges (or one range that
    # spans the entire time domain, when not using a trigger block). Here we iterate over each
    # of the ranges.
    for triggerRange in ranges:
        # triggerRange.GetValues() returns the values of the specified signal as a NumPy array,
        # which is cropped to the range, i.e. triggerRange.GetValues('Signal')[0] returns the first
        # value within the range, triggerRange.GetValues('Signal')[-1] returns the last.
        values = triggerRange.GetValues('Signal')

        # Analogously, triggerRange.GetTimestamps() returns the timestamps, cropped to the current
        # range. No signal name needs to be specified, as all signals are mapped to a common time axis.
        timestamps = triggerRange.GetTimestamps()

        # Check, whether triggerRange contains any values
        if values.size > 0:
            # values.max() returns the maximum value within the current range. The global
            # maxValue is updated accordingly.
            maxInRange = values.max()
            maxValue = max(maxInRange, maxValue)

            # thresholdExceededMask is an new Boolean array that contains True wherever the
            # corresponding element in values exceeds the given threshold.
            thresholdExceededMask = values > threshold

            # Report FAILED, when threshold is exceeded at least once
            if thresholdExceededMask.any():
                triggerRange.SetResultFailed()
                triggerRange.SetResultText('Threshold exceeded. Maximum in range: {}.'.format(maxInRange))

            else:
                triggerRange.SetResultSuccess()

        else:
            triggerRange.SetResultText('No values in the given trigger range.')

        # The report shall contain contiguous sub-ranges, where the threshold is either
        # satisfied or exceeded. The method CalculateRanges() can be used to create such
        # sub-ranges from a Boolean mask.
        reportElements = {
            False: ('Check OK', report.RESULT_ID_SUCCESS),
            True: ('Check FAILED', report.RESULT_ID_FAILED),
        }

        for subRange in self.CalculateRanges(thresholdExceededMask):
            triggerRange.Range(
                timestamps[subRange[0]], timestamps[subRange[1]-1],
                reportElements[subRange[2]][0], reportElements[subRange[2]][1])

    # Write back the determined maximum value
    parameters['maxValue'] = maxValue
After saving the edited Python class, the newly created array-based NumPy trace step template is available in the tab Trace step templates of the action window. Since the template has an output parameter, it requires a package variable that will be used for storing the output. For creating such variable, right-click in the tab Variables, choose and assign the name MaximumSpeed.

Creating a new package variable
Info
No Writing AND Reading of a package variable within one episode
A package variable being written in one episode can not be read in the same episode. Reading is only possible in the next episode.
Afterwards, insert the newly created CheckThreshold template into the trace analysis using drag-and-drop from within the tab Trace step templates of the action window.
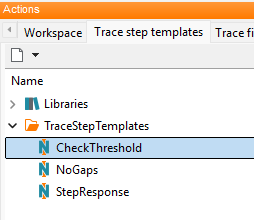
The trace step template “CheckTreshold” within the tab “trace step templates” in the action window
Inserting CheckThreshold will automatically open the corresponding parameterization dialog, where the following entries need to be made:
Bind the generic signal Signal0 to the input signal Signal of the template.
Set the threshold input parameter to 75.
Bind the newly created variable MaximumSpeed to the output parameter maxValue. To do so, press the down arrow key of your keyboard while editing the the corresponding value cell of the parameter table and select the variable from the list of suggestions.
The filled-in dialog should look as follows:

Parameterization of the trace step template
Now add a plot in which the signal and the results of the CheckThreshold trace step are to be
visualized. To do so, click the button  (New Plot) on the left side of the trace
analysis editor under Episodes and trace steps and accept the default plot settings by
clicking OK.
(New Plot) on the left side of the trace
analysis editor under Episodes and trace steps and accept the default plot settings by
clicking OK.
The analysis should now look as follows:

The finished trace analysis
After executing the trace analysis (by clicking the button marked in the previous image), the following result is displayed in the tab Test report:

Result of the trace analysis
The report contains the following central analysis results:
The threshold of 75 km/h was violated. The trace analysis therefore delivers the result FAILED.
The threshold violation took place between measuring time 44.400800 and 44.450200.
The maximum speed was 75.5 km/h.
Info
Further references
Creating user defined trace step templates is an essential aspect of trace analysis with ecu.test. A step-by-step guide for creating trace step templates can be found in the section Creating trace step templates. Details specific to array-based NumPy trace step templates can be found in the section Creating array-based NumPy trace step templates. The latter section also contains further examples that are based on this tutorial.