Creating array-based NumPy trace step templates
The procedure for creating a new trace step template has been explained before in section General approach. While the creation of signals and parameters is identical for all kinds of templates, the implementation of the actual analysis instructions is distinctly different.
Array-based NumPy trace step templates allow for user defined Python code, which can access the
values and timestamps of all input and output signals as NumPy arrays. The pivotal element of each
array-based NumPy trace step template is the implementing class’s Process() method, which gets
called once per trace analysis run and receives the following parameters:
parameters:A Python dictionary, which contains a value for each trace step parameter defined in the template.
report:An object, which facilitates access to the test report.
timeAxis:The common time axis as NumPy array of simple timestamps.
ranges:A list of trigger ranges. For analyses without triggers a single range, which covers the whole time domain described by the common time axis, is provided.
signals:A Python dictionary, which contains a signal object for each input and output signal defined in the template. The signal objects facilitate access to values and timestamps of the corresponding signal throughout its time domain.
A complete description of all relevant methods and interfaces for array-based NumPy trace step templates, as well as a note about enabling type checks and autocompletion in your external editor, can be found in the Trace Analysis API documentation.
Recommendations for further reading
The list below names several tutorials and examples that are recommended for further reading with regard to array-based NumPy trace step templates. All tutorials presume knowledge in programming with Python. Basic knowledge of the Python library NumPy is also advantageous and can be acquired by reading the section Using NumPy.
The tutorial Creating an array-based NumPy trace step template is based on the tutorial How to create a package with a trace analysis and explains how to create the array-based NumPy trace step template CheckTreshold, which is also supplied as an example template with ecu.test.
CountSamples is another example template that comes with ecu.test and is extensively documented to provide further insight into creating array-based NumPy trace step templates. (The example templates are stored in the subfolder
ExampleTraceStepTemplates/NumPyArrayBasedof the trace step template folder, presuming the option for copying the example files has been checked when opening the ecu.test-Workspace).The example Calculating an output signal in the following section demonstrates the calculation of signals using array-based NumPy trace step templates.
Thereafter, the example Time axis definition explains the options for handling time axes within array-based NumPy trace step templates.
Example: Calculating an output signal
The tutorial Creating an array-based NumPy trace step template gradually develops the trace step template CheckTreshold, which checks, whether a signal exceeds a given threshold. Following up on that tutorial, this example will now focus on the task of adding two signals and performing a threshold check for the resulting sum signal.
For the sake of keeping the template CheckThresold unaltered and available for further use, it is reasonable to perform the signal calculation in a separate trace step and apply CheckThreshold afterwards. Therefore, this example will explain how to develop an array-based NumPy trace step template AddSignals that adds up two signals and stores the result in a third signal.
First, create a new array-based NumPy trace step template named AddSignals (as has been shown in the tutorial) and declare the following signals:
Signal1 and Signal2, direction IN
Signal3, direction OUT
The template’s method Process() needs to be implemented as follows:
def Process(self, parameters, report, timeAxis, ranges, signals):
    """
    ...

    """
    outSignal = signals['Signal3']
    for triggerRange in ranges:
        timestamps = triggerRange.GetTimestamps()
        outValues = triggerRange.GetValues('Signal1') + triggerRange.GetValues('Signal2')

        outSignal.Emit(timestamps, outValues)
In order to use the trace step template AddSignals, at least three generic signals must be declared in the trace analysis - two that are to be added and one that will receive the calculated sum values. The latter signal is the one to be checked with CheckThreshold.
With the template AddSignals in place, follow the steps below to solve the overall task stated initially:
Create a new package.
Insert the
SigAB.csv(residing in the folderExampleTraces/NumPyArrayBased) with both of its signals SigA and SigB as signal recodings (as described in the section How to create a package with a trace analysis).Create a new trace analysis.
Declare the three generic signals Signal1, Signal2 and Signal3.
Bind recorded signal SigA to Signal1 and recorded signal SigB to Signal2.
Create a trace step using the newly created template AddSignals. Bind its input and output signals to the same-named generic signals of the trace analysis.
Create a trace step using the template CheckThreshold that was developed in the tutorial. Bind the generic signal Signal3 (which contains the output from the AddSignal step) to its input signal and specify a threshold of 10.
Attach a plot step to the CheckTreshold step. Configure the plot such that the generic signals Signal1 and Signal2 are plotted in addition to CheckThreshold’s input signal (by dragging the signals from not plotted to Upper plot). Set the marker style ‘o’ for all signals (by double clicking each of the signals and choosing that style).
After running that trace analysis, the resulting test report will contain the following plot:

Result of the threshold check for a sum signal
The plot shows the recorded signals SigA and SigB in blue and grey respectively and the sum signal in orange. Furthermore, the range beginning at timestamp 7 is highlighted in red, because the threshold was exceeded by the sum signal from this point on.
Example: Time axis definition
In the previous example, the two signals SigA and SigB came from the same CSV file
SigAB.csv, and were therefore sampled at identical times. A different image is obtained when
adding another recorded signal SigC from the file SigC.csv (also found in the folder
ExampleTraces/NumPyArrayBased) and binding it to the generic signal Signal2
(such that SigA and SigC are added):

Threshold check for a sum signal with standard time axis definition (‘Signal1 or Signal2’)
In the figure, the sampling times are highlighted as filled circles to emphasize the fact that
Signal3 was calculated wherever either Signal1 or Signal2 was sampled. In other words, a
common time axis has been formed, which contains the sampling times of both, Signal1 and
Signal2. This is the standard rule for forming the common time axis and can be expressed by
the termin Signal1 or Signal2, which automatically gets pre-entered when chechking the option
Time axis definition in the wizard for generating new array-based NumPy trace step
templates:
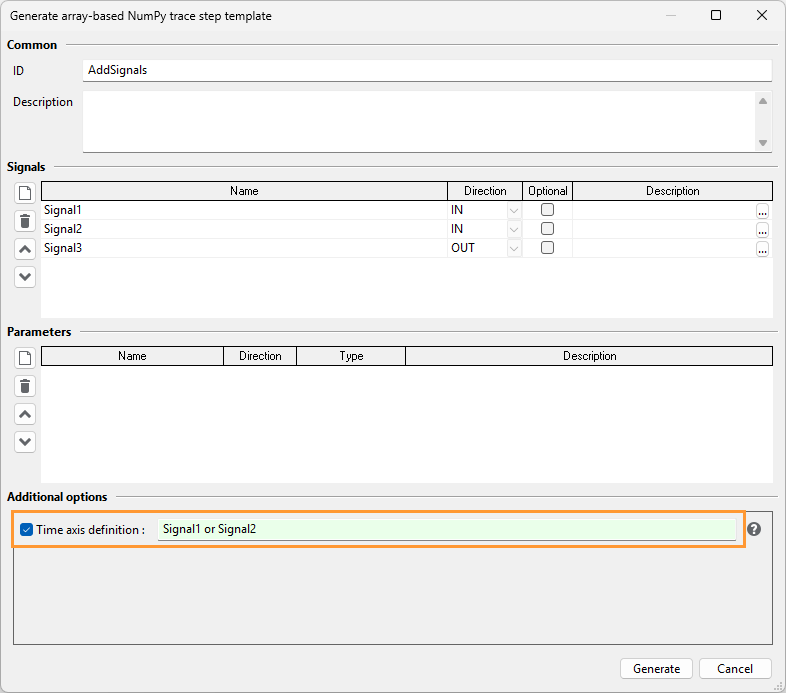
Wizard for creating array-based NumPy trace step templates with time axis definition
However, other time axis definitions can be specified either in the wizard or afterwards within the
method GetTimeAxisDefinition(). By implementing that method as follows
def GetTimeAxisDefinition(cls):
    return 'Signal1 and Signal2'
a common time axis is defined that contains only those timestamps, where both, Signal1 and Signal2 were sampled simultaneously. This will yield the following plot in the report:

Threshold check for a sum signal with the time axis definition ‘Signal1 and Signal2’
The following time axis definition involves only the sampling times of Signal2:
def GetTimeAxisDefinition(cls):
    return 'Signal2'
Applying this time axis definition yields the following plot:
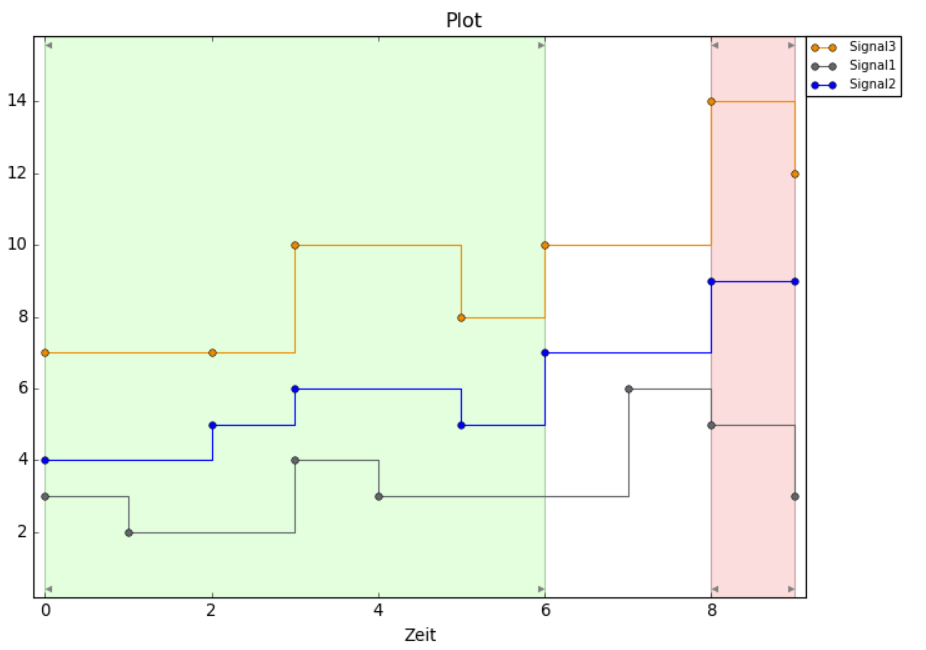
Threshold check for a sum signal with the time axis definition ‘Signal2’
Info
Within the method Process() of an array-based NumPy trace step template the methods
triggerRange.GetValues(...) and triggerRange.GetTimestamps() of a trigger range
triggerRange always relate to the common time axis. Therefore, they might introduce
additional samples by applying the sample-and-hold principle, if the original signal has
not been sampled at a timestamp that is included in the common time axis.
The methods signal.GetValues(...) and signals.GetTimestamps(...) of a signal object
signal deliver the original samples. The can also be constrained to a certain time range
by specifying the optinal argument fromTo.
For further details refer to the Trace Analysis API documentation.
Example: Helper functions
An array-based NumPy trace step template must inherit from the class
NumPyBasedTraceStep.
In addition to defining the general interface, this class provides some useful helper functions that
you can call in your own template either via self. or NumPyBasedTraceStep.. Below, we will
work with these helper methods in a Process method as an example.
def Process(self, parameters, report, timeAxis, ranges, signals):
    """
    ...

    """
    # Non-interpolated timestamps and values of Signal1
    signal1 = signals['Signal1']
    actualTimestamps = signal1.GetTimestamps()
    actualValues = signal1.GetValues()

    ############################################################################################
    # FitToAxis
    ############################################################################################
    # Example: Interpolate values of Signal1 to another time axis using sample and hold
    #
    # In this example, timeAxis, i.e. the common time axis of all input signals of the
    # template-based trace step, is used as the target time axis.

    interpValues = self.FitToAxis(actualTimestamps, actualValues, timeAxis)

    print(actualTimestamps)  # [0.0,      1.0,      2.0]
    print(actualValues)      # [1.0,      5.0,      9.0]
    print(timeAxis)          # [0.0, 0.5, 1.0, 1.5, 2.0, 2.5]
    print(interpValues)      # [1.0, 1.0, 5.0, 5.0, 9.0, 9.0]

    # Note: Such interpolation is performed automatically for all trigger ranges. For a trigger
    # range named triggerRange, triggerRange.GetTimestamps() provides the common time axis and
    # triggerRange.GetValues('Signal1') provides matching, possibly interpolated, signal values.


    ############################################################################################
    # CalculateMaskForRange
    ############################################################################################
    # Example: Determine a mask for all values of Signal1, which are in the right open interval
    # [1.0, 9.0)
    mask = self.CalculateMaskForRange(actualValues, minVal=1.0, maxVal=9.0, rightOpen=True)
    resultValues = actualValues[mask]
    resultTimestamps = actualTimestamps[mask]

    print(actualTimestamps)     # [0.0,      1.0,      2.0]
    print(actualValues)         # [1.0,      5.0,      9.0]
    print(mask)                 # [True,     True,     False]

    print(resultTimestamps)     # [0.0,      1.0]
    print(resultValues)         # [1.0,      5.0]

    for triggerRange in ranges:
        timestamps = triggerRange.GetTimestamps()
        interpValuesInRange = triggerRange.GetValues('Signal1')

        ########################################################################################
        # CalculateRanges
        ########################################################################################
        # Example: Check at which times Signal1 == 5.0 holds, and list subranges in the report,
        # for which the expectation was fulfilled or not fulfilled, respectively
        #
        # The example outputs assume a trigger range from 0.5 to 2.0 (open on the right,
        # therefore 2.0 is not checked).

        print(timestamps)           # [0.5, 1.0, 1.5]
        print(interpValuesInRange)  # [1.0, 5.0, 5.0]

        reportElements = {
            True: ('Check OK', report.RESULT_ID_SUCCESS),
            False: ('Check FAILED', report.RESULT_ID_FAILED),
        }

        result = interpValuesInRange == 5.0
        resultSubRanges = self.CalculateRanges(result)

        print(result)           # [False, True, True]
        print(resultSubRanges)  # [(0, 1, False), (1, 3, True)]
        for subRange in resultSubRanges:
            triggerRange.Range(
                timestamps[subRange[0]], timestamps[subRange[1]-1],
                reportElements[subRange[2]][0], reportElements[subRange[2]][1])