Logging tab
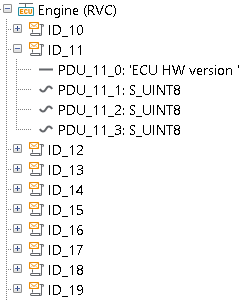
The Logging tab displays all control units, whose log recordings can be read by
ecu.test. Different control units are labeled by the ECU symbol  .
.
The Logging feature receives messages (frames,  ) sent by the respective
control unit. Currently, only the Diagnostic Log and Trace (DLT) protocol is supported.
) sent by the respective
control unit. Currently, only the Diagnostic Log and Trace (DLT) protocol is supported.
The DLT protocol is used in two modes: verbose and non-verbose.
Non-Verbose Mode
In non-verbose mode, a description file specifies which messages exist and what
arguments they contain. This description file (Fibex, .xml) can be
set in the test configuration.
These arguments can either be constant ( ) or variable (
 ).
Both kinds can be made available for trace analysis via drag-n-drop to the
Signal recordings tab. Supported are
).
Both kinds can be made available for trace analysis via drag-n-drop to the
Signal recordings tab. Supported are .dlt and .pcap recording files.
A DLT recording usually contains DLT messages of several control units. Therefore an ECU-ID to be filtered on is specified in the test configuration. If this field is empty, no filtering is performed.
Verbose Mode
In verbose mode, each DLT message itself contains a description of the signals it is comprised of. There is no separate description file.
In order to make these message usable with ecu.test anyway, a filter configuration can
be used. In particular, a .dlf file in the format of the COVESA’s DLT Viewer
can be referenced in the test configuration.
Each filter from the file gets displayed in the Logging tab as a message.
It is important to note that in order to filter the messages of a specific control unit, the Filter configuration must be added accordingly.
Such messages can be evaluated in the test case by means of a read test step. The test step will read the most recently received message that matches the filter (or, in case of a negative filter, that does not match the filter) in the form of a DltMessage object.
In the test report, this object is recorded as text, with all relevant properties. When saving the object in a test case variable, all methods and properties described in the API documentation can be evaluated e.g. in a subsequent calculation test step.
DLT messages of this mode can also be dragged into the Signal recordings tab.
In this case, all DLT messages matching the source IP address and port given in the
test configuration get recorded (irrespective of the filter). The recording is saved
in the .dlt format, so that the messages can not only be read out in the trace analysis,
but can later be reviewed e.g. in the aforementioned DLT Viewer.
Info
Using the shortcut CTRL+F, it is possible to search for certain messages or arguments.