Control units tab
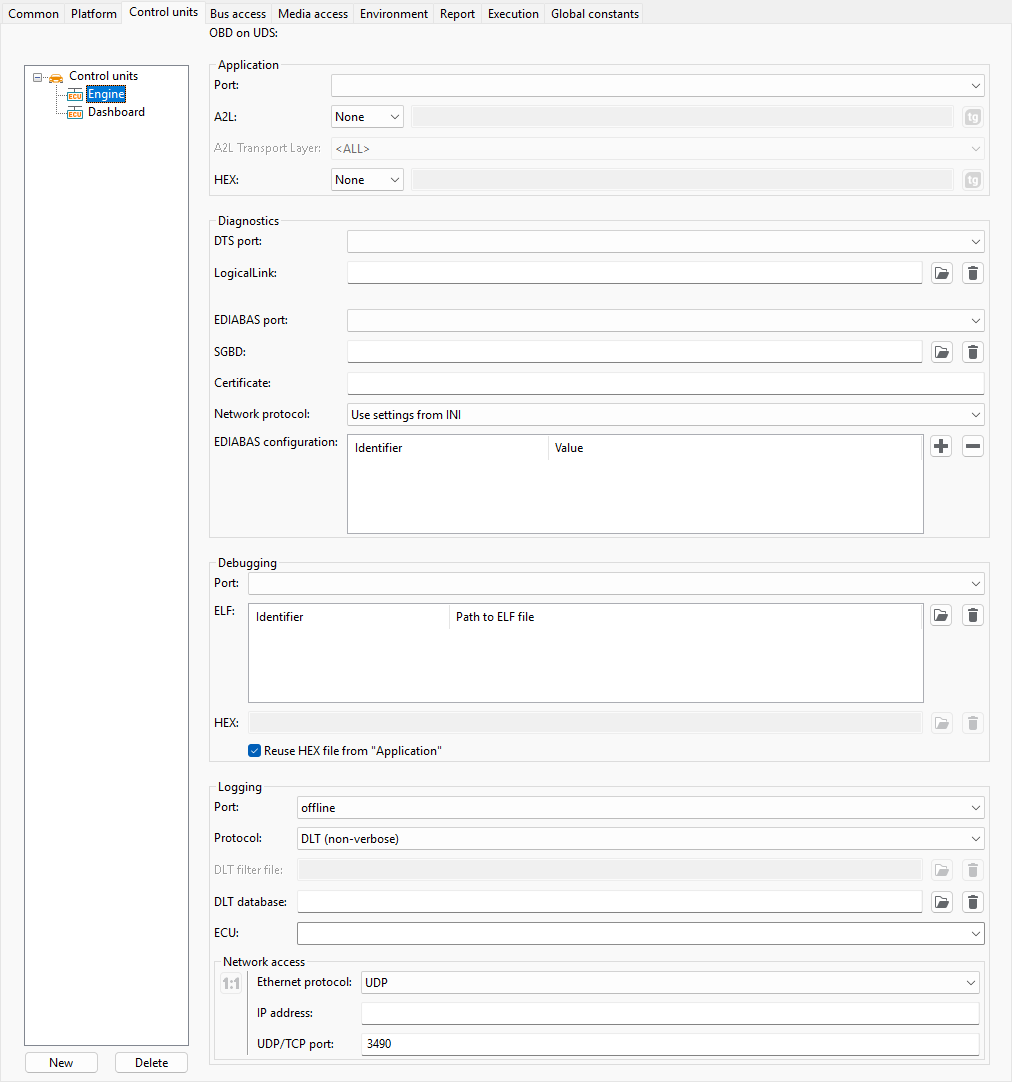
The tab Control units can be used to configure access to control units or function groups.
The tab consists of two sectors. On the upper left side a tree represents the control units to be used. On the right side there is the selection of software interfaces by which control units can be accessed.
Using the button New a new control unit may be added. As soon as the key is hit you can see a selection dialog by means of which the kind of control unit can be determined. This defines the name at the same time. The button Delete serves to remove control units inserted before.
On the right the interfaces for control unit access are configured. There are fields for information about data sources necessary to configure and control test software. The available buttons can be used for editing. The fields just mentioned will now be described in more detail here below:
Application
A2L: Here the
*.a2lfile is indicated in conformity with the program status of the control unit (ASAP2 standard). Using the information of this file it is possible to access measurement and adjustment quantities either by means of an application device (e.g. CAN calibration protocol (CCP) or emulator test probe (ETK)) or an active diagnostics plug (ADS, serial interface via bi-directional one-wire bus, KWP2000, ISO 9141-2 standard). In case the used tool adapter supports online querying of measurement or calibration variables, specifying an A2L file is optional. This functionality is currently supported by e.g. ASAM: XIL.A2L Transport Layer: The Add-on ecu.test calibration needs a selected transport layer in order to determine the right connection settings. The selection does not affect other measurement and calibration tools, so the default value <ALL> can be kept. Selecting <ALL> provides all available acquisition rates. The field accepts global constants, too.
HEX: Here the
*.hexfile is indicated which belongs to*.a2l.
Info
*.a2l and *.hex files may also be artifacts from test.guide. For this
purpose please configure a test.guide depository in the settings.
The depository can then be selected as a file source.
Diagnostics
Info
Diagnostics can only be used with the Add-on ecu.test diagnostics
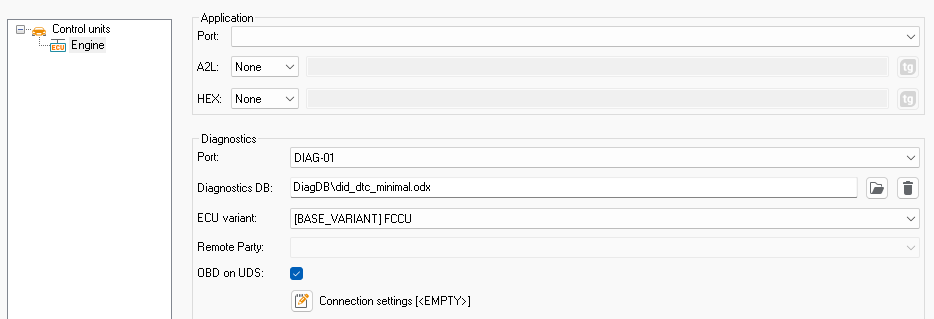
The configuration of the diagnostic functions is specified in the test configuration under the tab Control units. First, an ECU must be selected or added. A diagnostic session can be configured for this ECU, using the following options. They can be found within Diagnostics area on the right side. The name of the control unit, also referenced as SUT, can be used as a job parameter in order to reference the configured session.
Port
The Port represents the assignment to a tool port, which is defined in the test bench configuration. CAN and FlexRay diagnostic ports of the close-to-hardware bus connections as well as DoIP and DoSoAd ports of the ethernet connection are supported.
Info
A FlexRay diagnostic port also needs a FlexRay bus port to be configured having the same controller number and enabled transmission confirmation.
Diagnostics-DB
A diagnostic description file, e.g. ODX, can be chosen under the Diagnostics DB option. All available diagnostic services will be read from this file and offered as generic test steps. These will appear as new Diagnostics tab, once the configuration is activated.
ECU variant
A diagnostic DB can contain different ECU variants. To retain an overview, a specific variant can be selected in the ECU variant dropdown menu. If all variants are to be generated, the option <ALL> can be selected. If no variants are available, the menu is grayed out.
Remote party
If remote parties are stored in the diagnostic description file, they are displayed in the corresponding dropdown menu Remote Party. If no remote party exists the option is grayed out and an appropriate warning is displayed. In case a remote party is selected, the parameters contained in the diagnostic description file are are set in Connection settings automatically. Parameters already specified can be overwritten!
OBD on UDS
The checkbox OBD on UDS allows to select whether the OBD on UDS data basis is to be loaded for the tool port selected as Port. This will make the diagnostic services defined by this standard available in Diagnostics tab. This option can be used independently or together with a diagnostic description file provided for Diagnostics DB.
Connection settings
Under the Connection settings option, specific settings for the diagnostic session can be defined. The chosen settings for CAN-ISO-TP, FR-TP, DoIP and DoSoAd will only affect corresponding tool ports. The available UDS options will always apply. If a value was selected for Remote Party the dialog will be initialized with values from the diagnostics DB, which can be edited.
Diagnostics(DTS)
LogicalLink
If a Diagnostics(DTS) port is indicated a logical link can be selected here that is assigned to the control unit or the functional unit. Available logical links are retrieved from the diagnostics project indicated in the test bench and are offered for selection.
Diagnostics(EDIABAS)
EDIABAS port
The port represents the assignment to an EDIABAS port which is defined in the test bench configuration.
SGBD
Here the control unit description file is indicated for the control unit in question.
By means of the file selection button ( ) the following selection list is
shown:
) the following selection list is
shown:
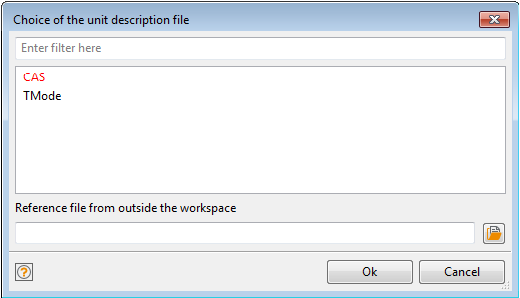
A control unit description file (SGBD) can be selected from the list, available either online
(*.prg or *.prg file) or offline (*.xrg file). The online files
possess a format which can only be read by means of EDIABAS.
However, ecu.test uses the offline unit description file. Thus at every start of the test environment the chosen online unit description file is converted by EDIABAS into a offline unit description file and will be stored in ecu.test. Once converted, the description files can be used for test case creation, even without connection to EDIABAS.
In case of *.grp files, ecu.test repeats the conversion into the offline file
at each start of the test environment, because the content of the SGBD depends on the actually
connected ECU, and can thus change between two conversions without the *.grp file
itself changing. This conversion will fail if the ECU is neither reachable nor has a simulation
set up for it.
The indicated files differ by the color of entries:
black means the control unit description file is online available
red is the color of files which are only locally available in offline format. In that case the test execution is not possible.
It is possible to use a local description file in the online format by referencing it with an absolute path in the text control at the bottom of the window. In that case this file will be transferred to the tool host while configuration start.
Certificate
The file name without path and without extension of the certificate file for S29 authentication can be specified here - see .ini setting ‘SelectCertificate’ in EDIABAS. The certificate file is expected by EDIABAS in the path for S29 certificates (SecurityPath).
Network Protocol
Selection of the EDIABAS network protocol for remote diagnostics, as it is also configured as ‘NetworkProtocol’ in the EDIABAS.ini. If ‘SSL’ is selected, the EDIABAS configuration setting ‘Authentication’ is set automatically to ‘S29’. A change of the network protocol is only supported by EDIABAS in certain configurations - see EDIABAS documentation. If EDIABAS does not support the selected setting, the start of the tool is aborted with an error.
This is a global setting in EDIABAS, so all control units should use the same setting or do not change the setting from the EDIABAS.ini file.
EDIABAS Configuration
Further configuration settings can be made here. The names and values can be found in the EDIABAS documentation. If EDIABAS does not support the selected setting, the start of the tool is aborted with an error.
Debugging
If a debugger is used, it is possible to specify ELF and HEX files that will be transmitted to the Tool Server computer.
Multiple ELF files can be defined and be assigned a generic identifier. The identifier can be chosen freely (). It will be displayed in the action window Debugging tab and is part of the mapping target (instead of the file name) when reading and writing symbols . This allows to replace the ELF file without the need of changing the mapping targets.
When the configuration is started, the ELF files are parsed and found symbols are displayed in the Debugging tab.
A HEX file can be specified that will be flashed automatically to the target (if this is supported by the tool). If the option ‘Reuse HEX file from “Application”’ is checked, the same HEX file will be used as specified above in the section Application.
Logging

Logging can be used for online access and recording in the test case as well as resolving of log messages in the trace analysis.
For the protocol, DLT (Diagnostic Log and Trace) is used in the two modes verbose and non-verbose.
Verbose mode supports the DLF format (.dlf). For this option, the
connection settings must be entered manually. In Non-Verbose mode, the corresponding
DLT-Fibex database (.xml) contains the connection settings.
The function of the individual setting parameters can be taken from the tooltips.
After starting the configuration, the messages and arguments found are stored in the Logging tab is displayed.